
Release November 2023 (before christmas break)
We are happy to deliver the brandnew November 2023 release with the new showcase “Integrated P&L Reporting” and a performance boost for aggregated queries! Try it now!
Remember, the Web Client is the user friendly spreadsheet for your Collector Users to deliver their monthly/weekly/daily data. The Web App is the tool for the Power User to setup and control your organization’s collection workflows.
(1) Showcases: New “Integrated P&L Planning”
We are very happy and proud to deliver the brandnew “Integrated P&L Planning” showcase which is powered by our partner company 4C Group AG in Munich:

1a. Landingpage
On the Landingpage you can see three planning areas and the corresponding elements (and element types) in the (unfiltered) dimension tree.

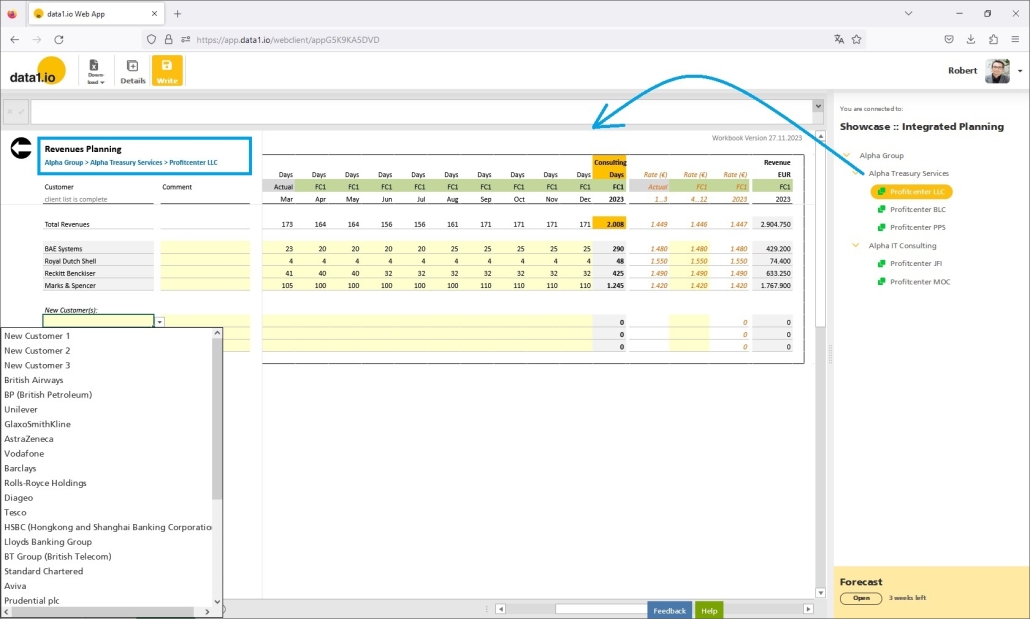
b. Revenues Planning
The showcase company is a service oriented company which sells consulting services on a days basis. Therefore the revenues planning is a quantity x price planning process. The relevant customers within a profit center can be selected from a prefined list of customers and then the Forecast values for the number of days and the average rate is entered (in the yellow cells). From a technical point of view the customer list is realized with a dynamic list query:
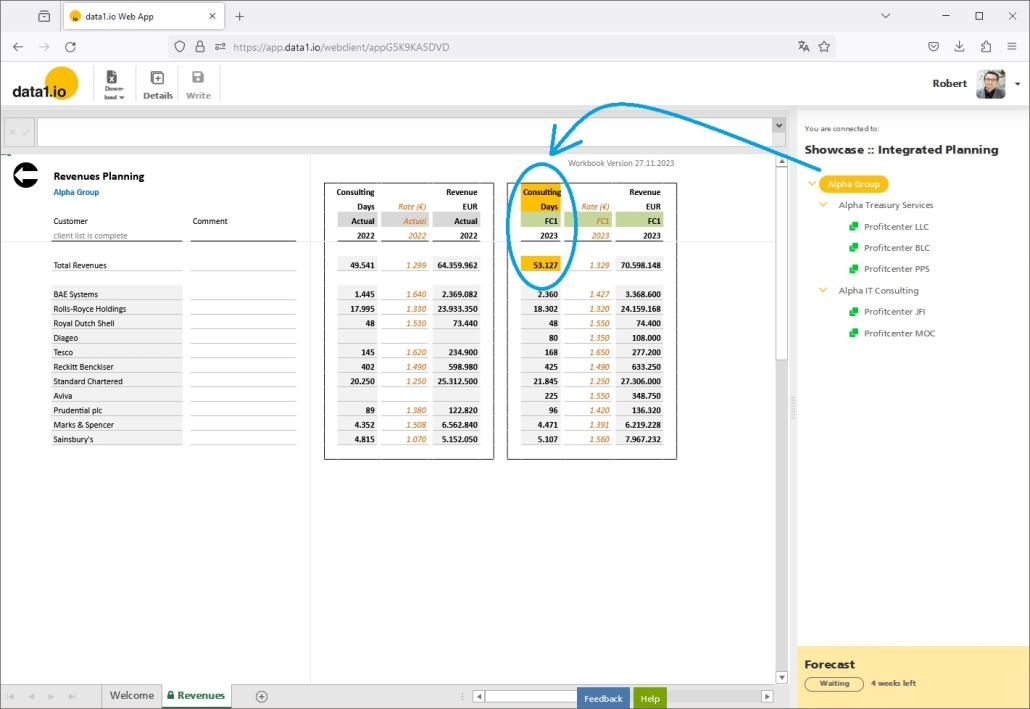
This results in a total sum of revenues and a total sum of Consulting Days, which is important for the next planning area, the HR capacities planning:
c. HR Capacities Planning
The HR capacities planning is a also quantity x price planning. The data entry is done on a single capacities element within each company. Similarly to the revenues planning the number of roles is variable and can be selected from a dropdown. The user enter only the number of FTEs per role and the number of available consulting days as well as the HR cost is calculated automatically with pre-defined factors per role.
The special feature here is the comparison with the planned consulting days from the revenues planning, since the capacities must fit to the sold volumes. From a technical point of view the consulting days are retrieved from the sum level above the Capacites element, this is realized with an “alternative levels” query parameter which we introduced last month in the October 2023 Release.

The HR capacities planning results in a total sum for Capacities Days (compared with the Consulting Days) and a total sum for HR cost:

d. EBIT Planning
The final step is the cost planning on an account basis per cost center …
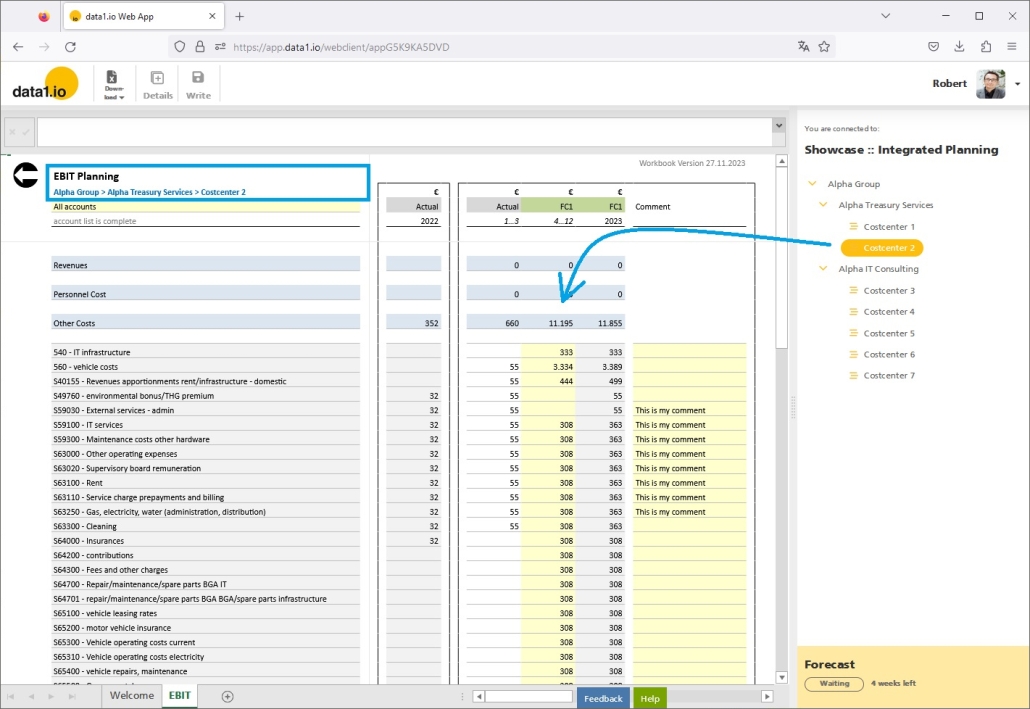
… and joins the parts from the revenues and the HR capacities planning together …

… and delivers the final EBIT:

(2) Web Client: Performance boost for AGGREGATED and ALWAYS ENCRYPTED queries
We have invested a lot in boosting the performance of aggregated queries. Until now, using aggregated queries usually led to a poorer performance since the aggregation had to be retrieved in seperate (and there additionally) query on from the database which resulted often in a poorer performance than using a lot of hidden rows or columns to retrieve the data on a non-aggregated level.
With this release we have made major performance improvements in the following areas:
- Aggregated RANGE queries
All queries are executed in one run on the server (and not in the database) - Aggregated YEAR/QUARTER/MONTH queries
Also here, all queries are executed in one run on the server (and not in the database) - ALWAYS ENCRYPTED
The sum up of the single records is done now with a new group by index on the server (since this is not possible in the database) - New INDEX on the fact table
At this stage this index is not created by default
For instance, the report HR Totals in the HR Contracts showcase uses RANGE queries. This report is now very fast …

… since all the data is queried from the database with only one single request:

(3) Web Client: new function “Analyze write process”
We have invested in another analyzer tool – we are happy to presend the brandnew “Analyze write process“! You will find it in the context menu of the dimension tree when you additionally press the “Ctrl” button on your keyboard:

On the first tab you can see a preview of the fact records that will be generated out of the cell values within the workbook sheet when you later will press the Write button:

On the second tab you see something very interesting and usefull: the cell values that will NOT be transformed in fact records and also the reason why:

Last but not least you can also fill all the writeable cells …

… with random values:

We hope that this new tool will help you to better understand what consequences your definitions will have on the fact records that will be generated during the write process.
(4) Web App: Performance Analyzer improvement
We have done another improvement for the Performance Analyzer (started with the shortcut “Ctrl + Alt + P”). When you hover the pie chart you can see not only the relative share but also the absolut duration in seconds:

(5) Web App: E-mail sender in journal
In the October 2023 Release we have introduced the new e-mail sender settings. This month we have added the E-Mail Sender column to the Sent E-Mails Journal:

This is important when you change the E-Mail Settings from default sender to company specific mail adresses since then the mail adress(es) from the workflow organizer(s) are used.

(6) Showcases: Removed “S&OP Demand Planning”
We have removed the showcase “S&OP Demand Planning” since it is replaced by the new “Integrated P&L Planning” showcase.

(7) Debugging and Improvements
(will be delivered)
Hope you like the new features – we are very curious about your feedback!
Please let us know what you think and what kind of collection processes you would prefer to automate with data1.io.
We`ll be back after christmas break with the January Release!
we #StandWithUkraine


Leave a Reply
Want to join the discussion?Feel free to contribute!