Release October 2021
We are happy to deliver the brandnew October 2021 release with the next version of the Power BI Custom Visual . Try it now!
Remember, the Web Client is the user friendly spreadsheet for your Collector Users to deliver their monthly/weekly/daily data. The Web App is the tool for the Power User to setup and control your organization’s collection workflows.
(1) Power BI: New Custom Visual (Gen2)
In the May 2021 release we introduced the first version of our Power BI Custom Visual (which was a prototype):
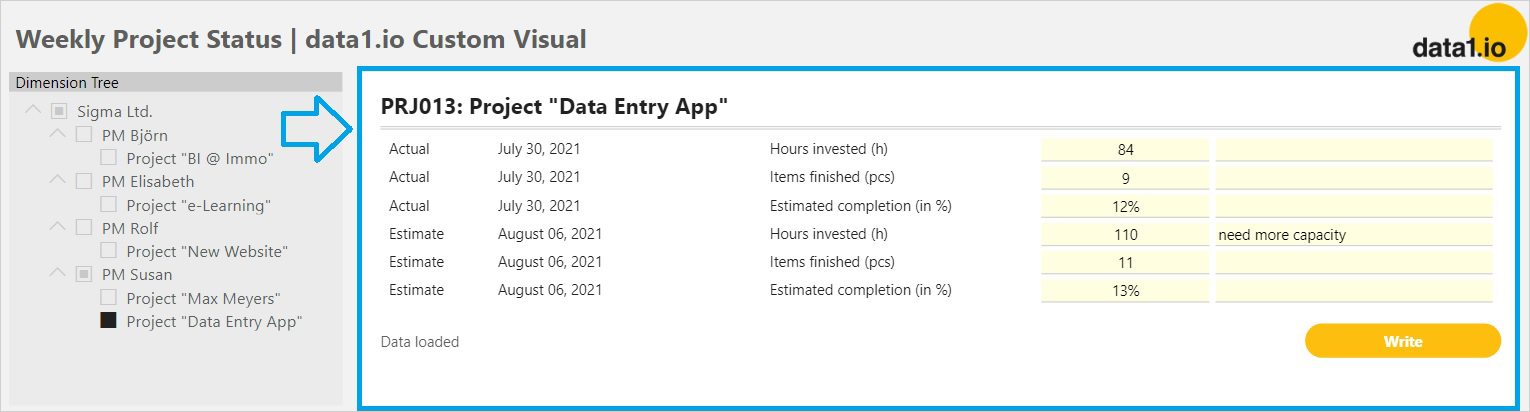
Now, we invested for the next generation of this visual to make it not only more beautiful but also more powerful:
- Measure and text as columns
- Multi-Project editing at once
- Filter not only for projects but also for dates
- Free configuration of the data1.io ODATA parameters in the settings of the visual

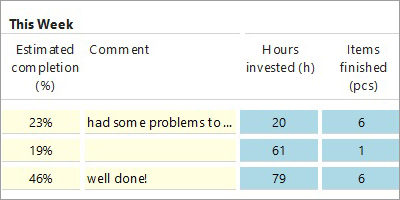
Just edit the values and texts in the custom visual and immediately see the aggregation in the Power BI charts and tables (by using a Direct Query datamodel with automatic Change Detection):
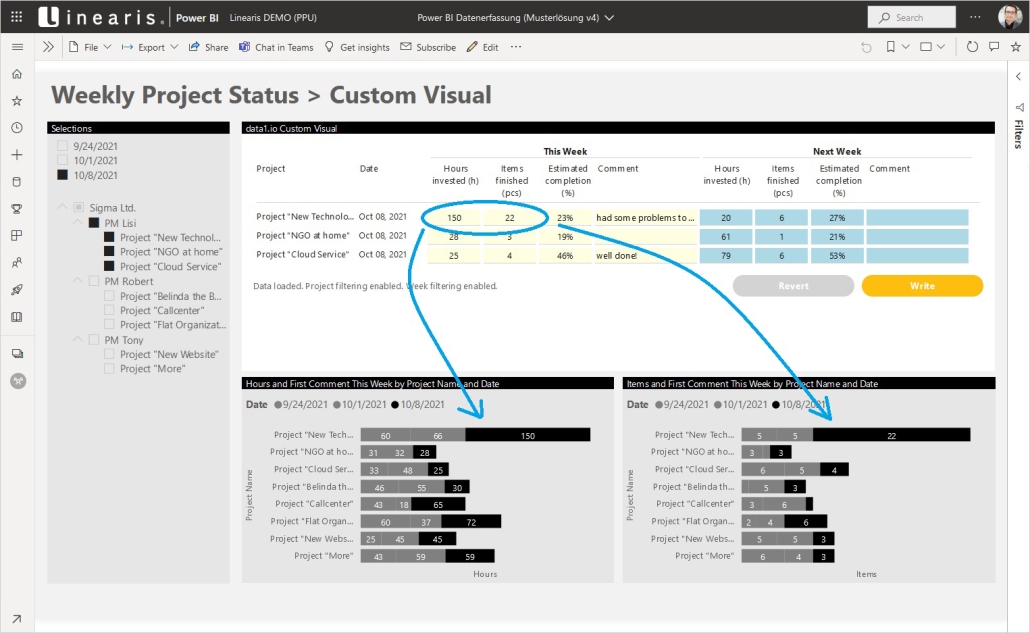
Sure, you can use the Power BI Custom Visual and the data1.io Web Client in parallel, both clients show the same values from the data1.io application (of course):
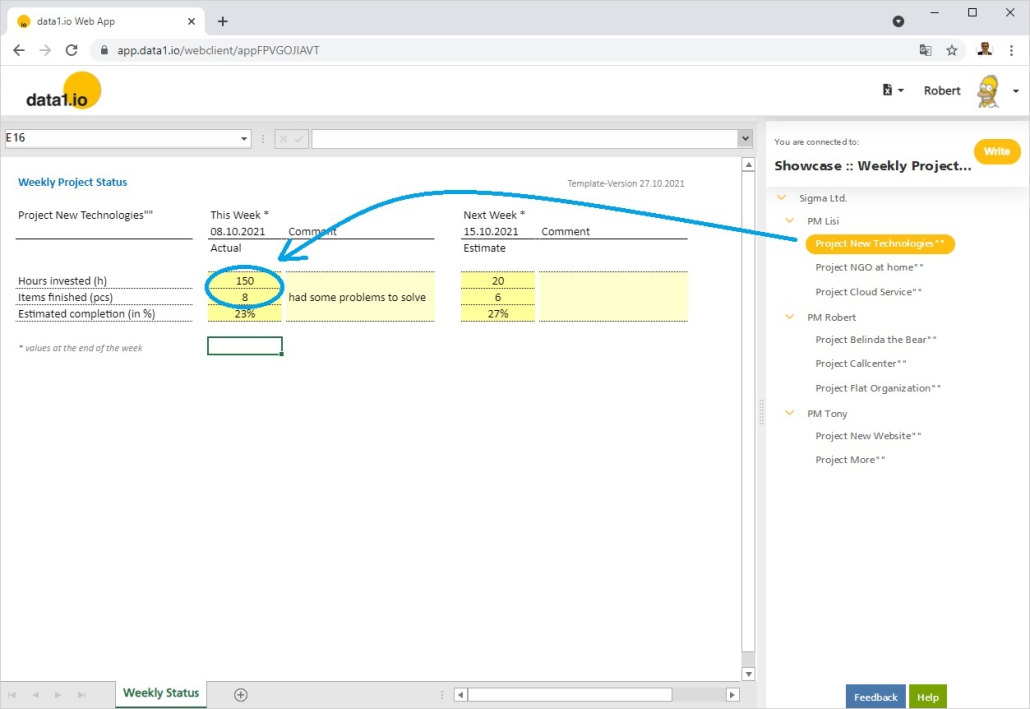
Please be aware that also this Gen2 visual is a proof-of-concept and not part of the data1.io production environment. If you are interested in usimg this technology for your company please feel free to contact us!
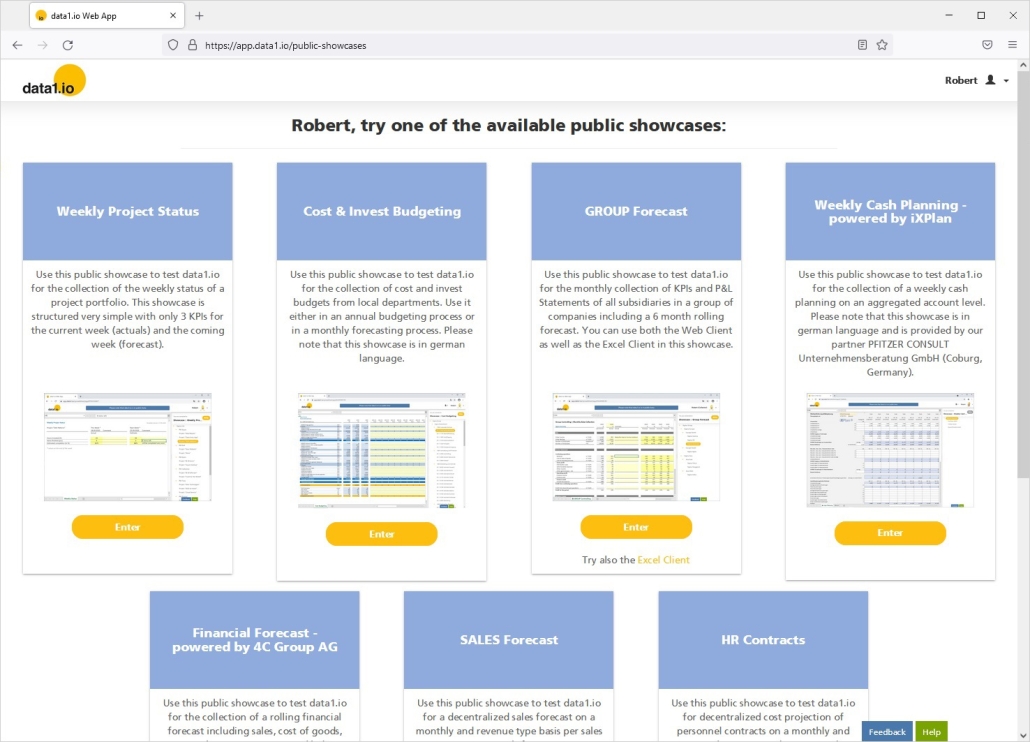
(2) Web App: New Design for the Public Showcases Page
We are happy to present our new Public Showcases landing page which is more compact and up-to-date:
Just for comparison, this was our old page:
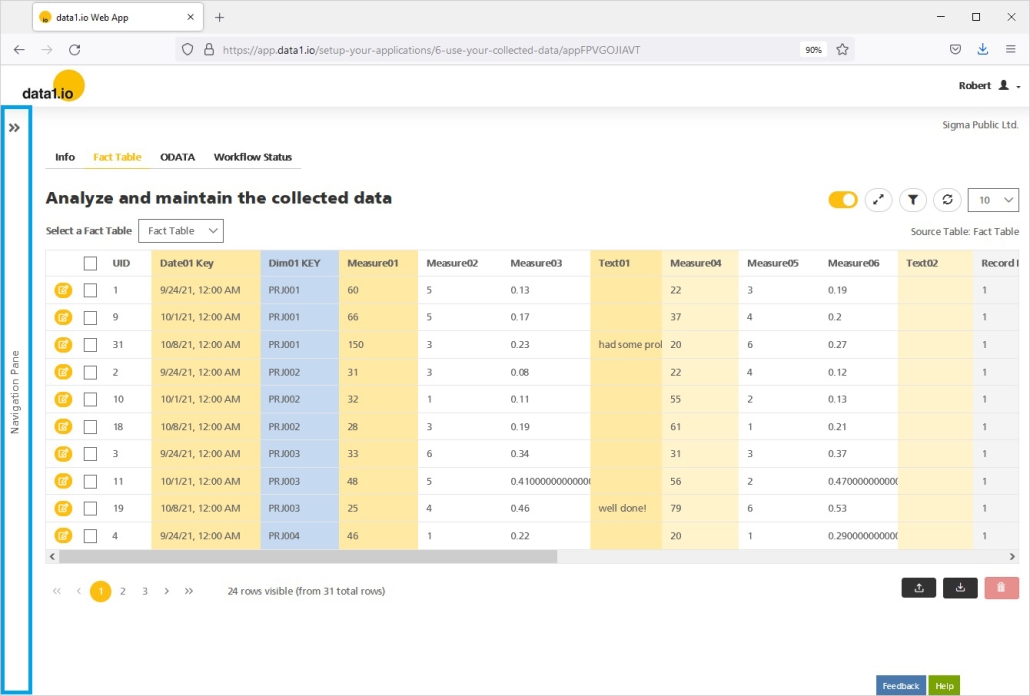
(3) Web App: New Hide/Unhide for the Navigation Pane
Analyzing or editing wide tables needs more space – therefore we have implemented the new hide/unhide function in order to expand or collapse the navigation pane:
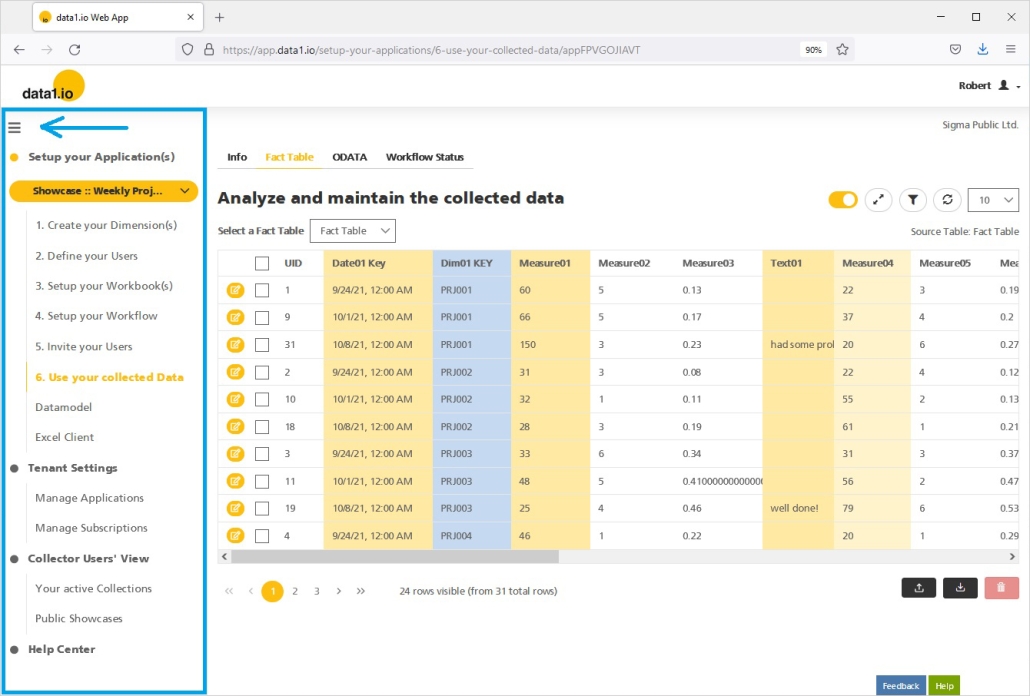
Here we go:
(4) Web Client: Improvements for the Showcase “Weekly Project Status”
Due to the the Power BI Custom Visual as well as due to our tests with Power Apps we decided to streamline the anyway small showcase for “Weekly Project Status”:
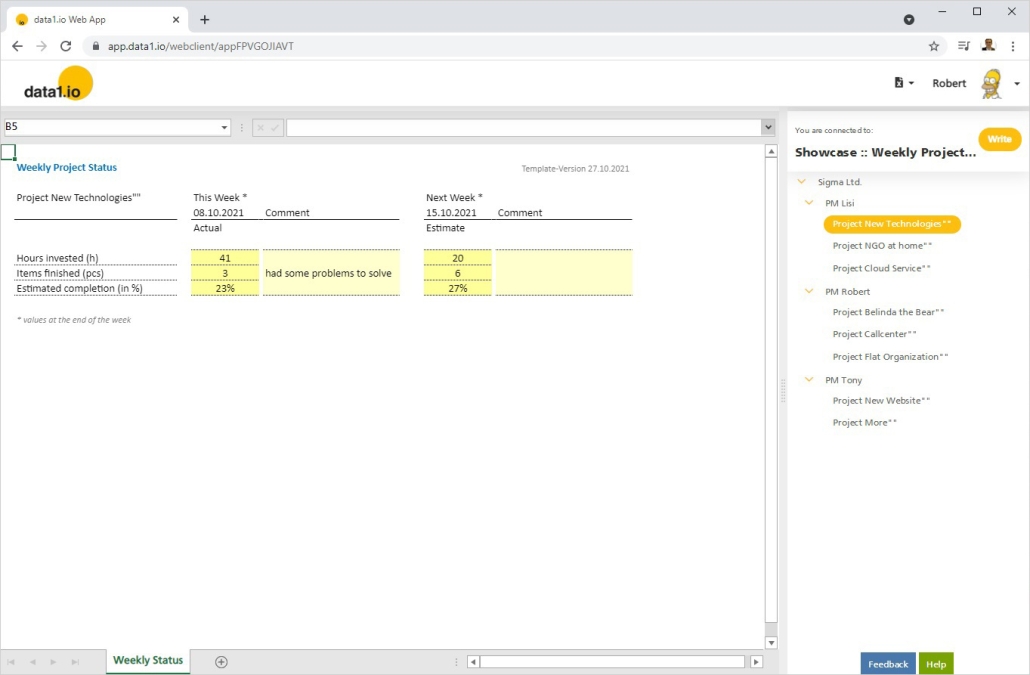
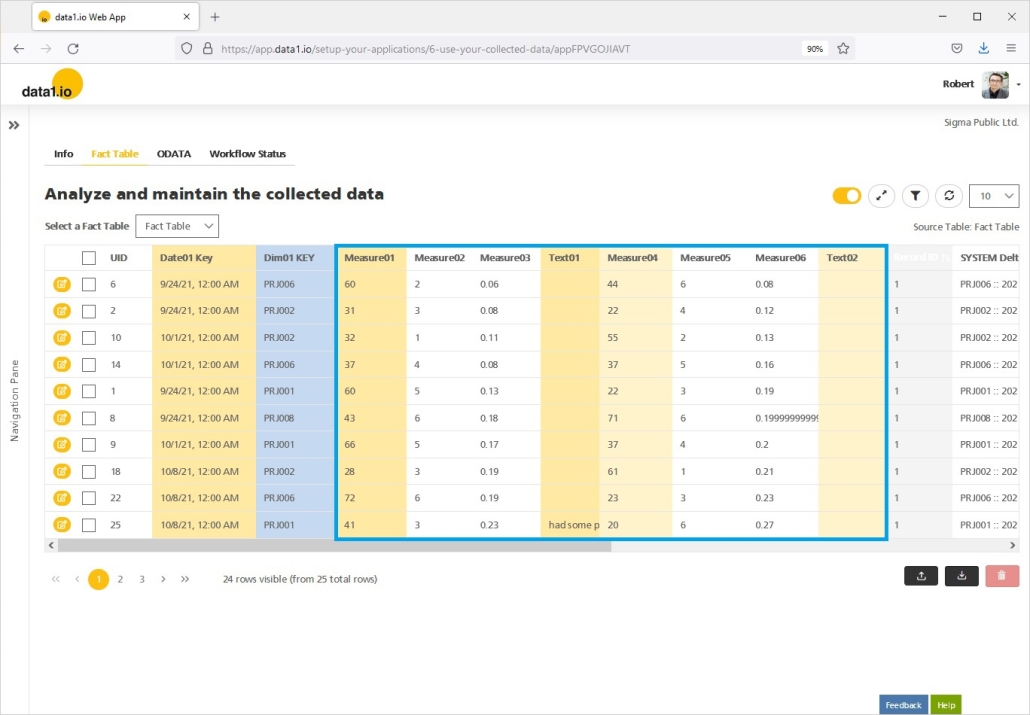
Furthermore we changed the record structure for this showcase “from vertical to horicontal”, i.e. several values and texts are now stored on the same record in the fact table:
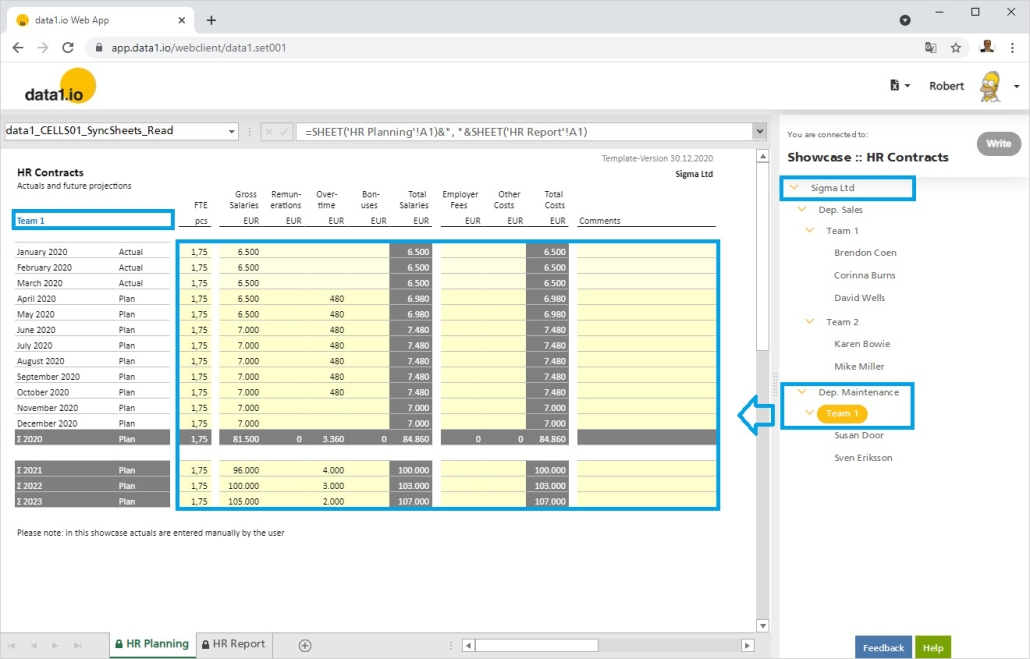
(5) Web Client: Improved query for same name level elements
Formerly there was a problem with elements on the same level with the same name: the data1.io query engine summed up all values with this element name but took not into account the branch of the dimension tree. Now we have changed that and the query engine retrieves the aggregations for an element by querying also the above levels of the element.
This way, two “Team 1” elements on the same level of the dimension tree get the right aggregated values on both elements:

For the sake of completeness: this feature was already implemented in May 2021 but not communicated until now.
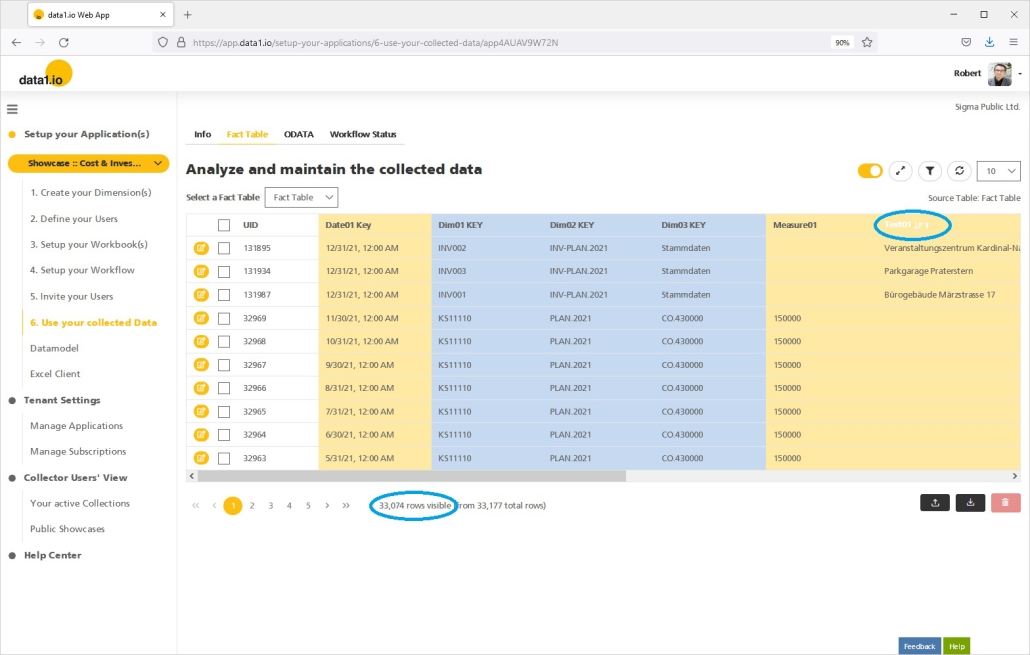
(6) Web App: Improved sort & filter for text fields in large tables
With the May 2021 release we introduced the new paging mechanism for large tables (> 1000 records). One remaining issue was sorting & filtering for text fields in such tables, which was only applied to the 1000 records in the current page. This is solved now so that filters and sort commands are applied in the backend to the whole table:
For the sake of completeness: this feature was already implemented in May 2021 but not communicated until now.
(7) Technical improvements and debugging
We had an issue when uploading data into the fact table which contain empty strings (“”) instead of null in the dimension key fields. As a consequence the values of such records could not be shown in the workbook, this is solved now.
Furthermore we improved the READ performance in multi-sheet workbooks, since we found out that the recalculation was done for every sheet although once for all does the same job in much less time.
Finally, records with empty date fields in the fact table caused an error when the table was downloaded, this is solved now as well.
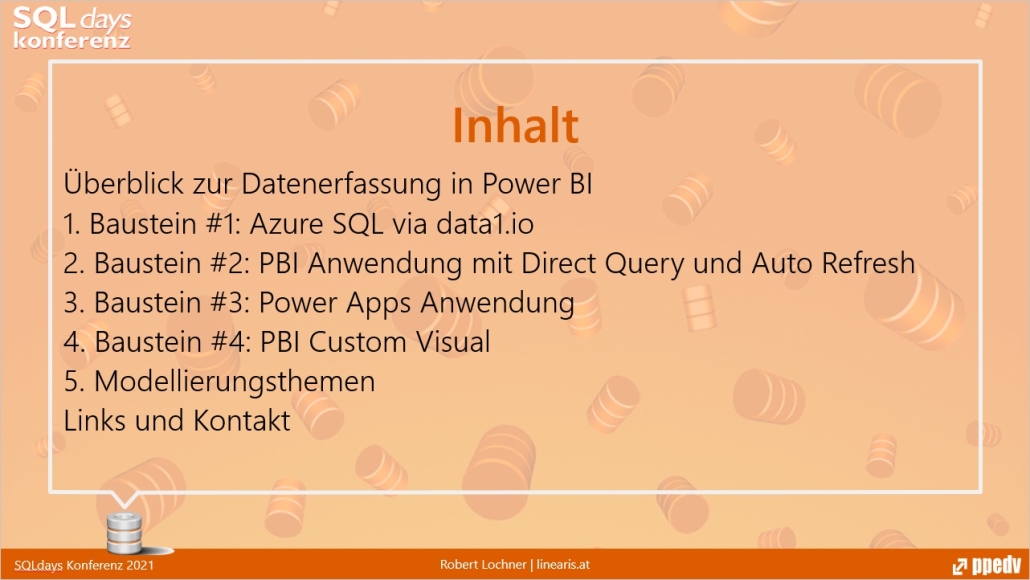
(8) SQL Days 2021 “Power BI and Data Entry” (in German)
Two weeks ago I had a session at the SQL Days 2021 in Munich (Germany) called “Power BI and Data Entry”:

I used data1.io as “SQL based planning engine” to show how a Direct Query application in Power BI has to be setup and how Power Apps and Power BI Custom Visual can be used as alternative frontends to Excel:
Find more information here (in german language):
https://linearis.at/blog/2021/10/29/session-power-bi-und-datenerfassung-bei-den-sql-days-2021/
(9) Supplement license information
We added a supplementary row to our pricing page in order to make clear that the Free Plan as well as the Enterprise Plans have limits concerning number of records and the resulting READ performance. So, there is not a limit for the number of records but the READ performance will go down the more records you will put into the fact table of your data1.io application:
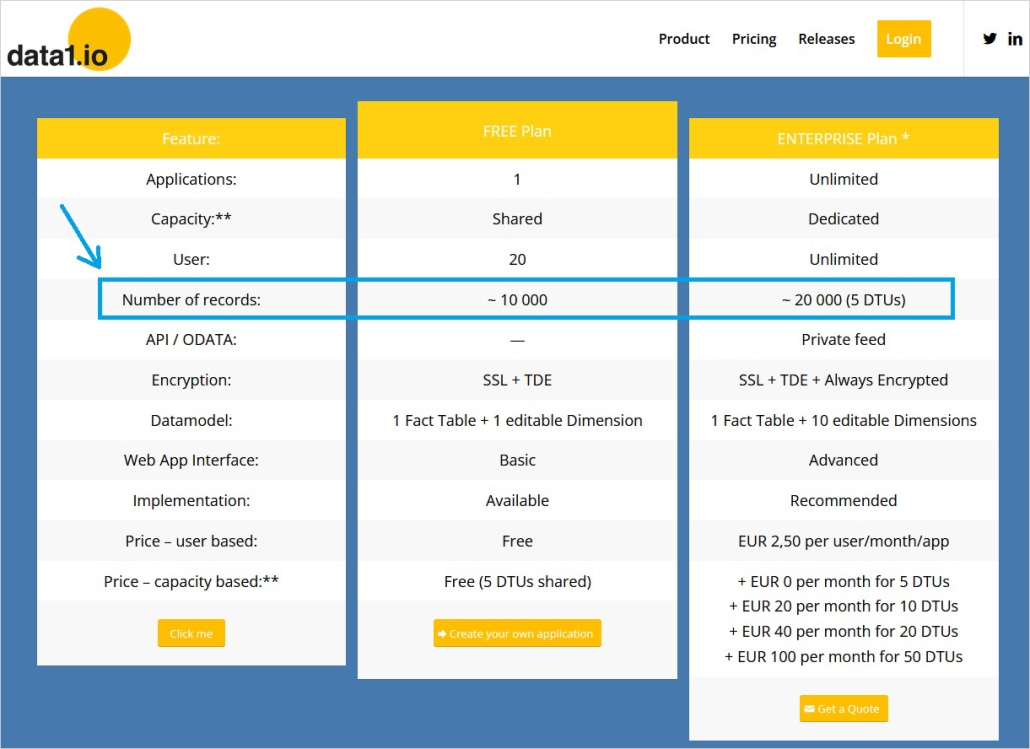
The solution for larger application is “calculation power” in the form of additional DTUs (see bottom right).
Hope you like the new features – we are very curious about your feedback! Please let us know what you think and what kind of collection processes you would prefer to automate with data1.io.
And: stay healthy!


Leave a Reply
Want to join the discussion?Feel free to contribute!