Release May 2023
We are happy to deliver the brandnew May 2023 release with important new workflow options in the Web App! Try it now!
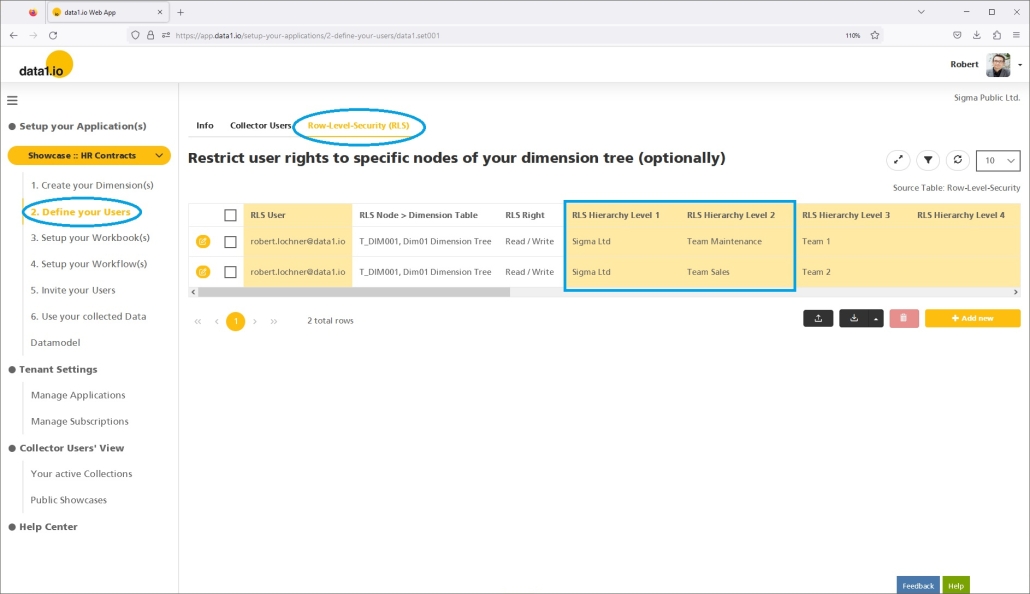
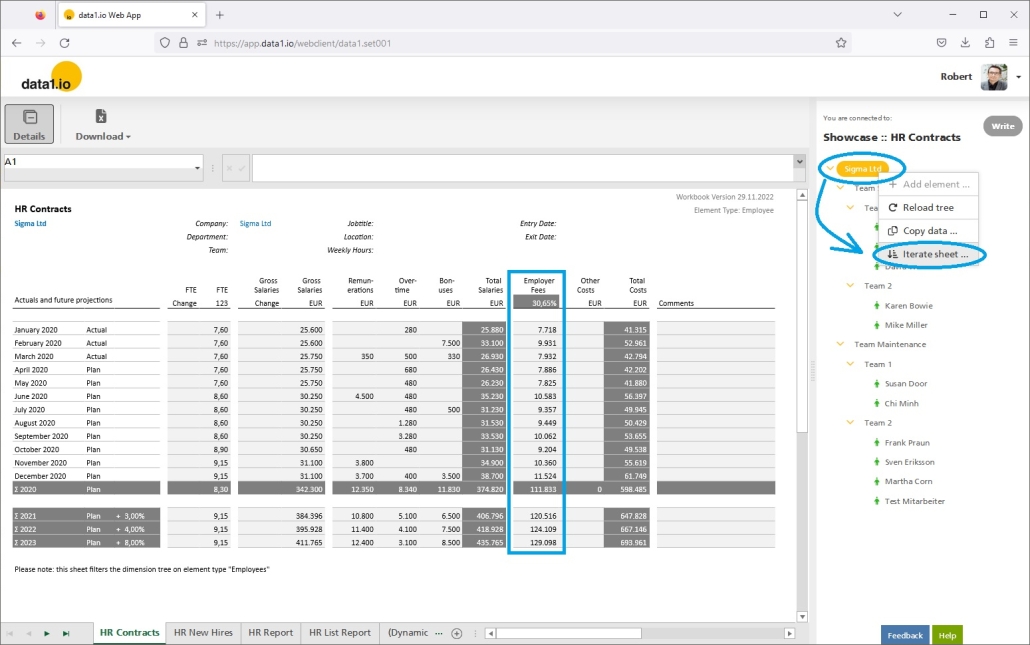
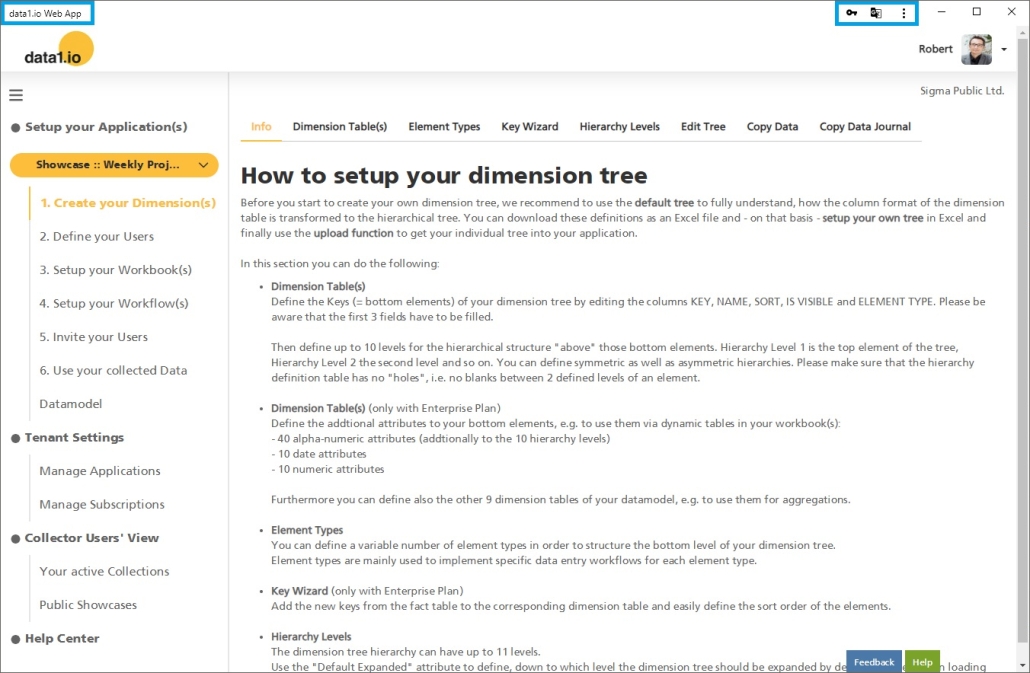
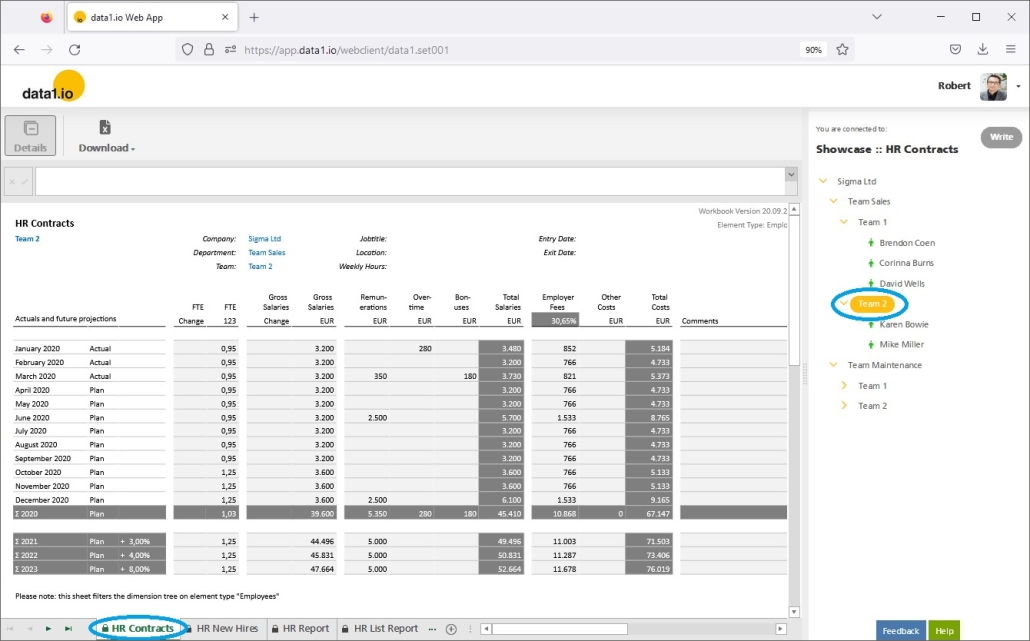
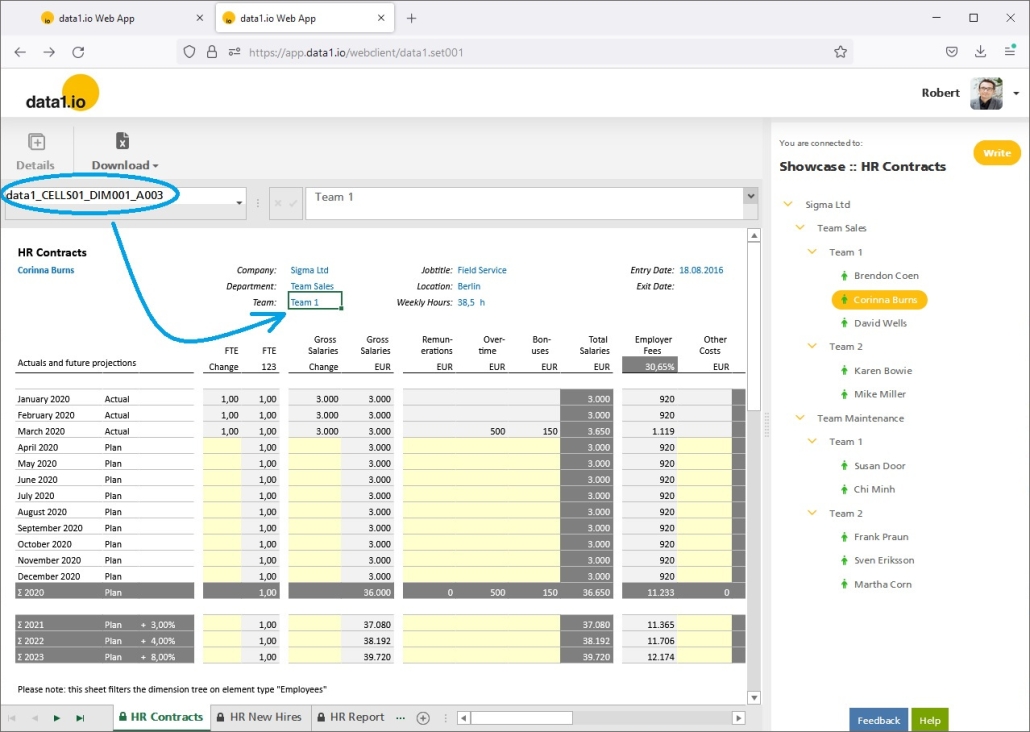
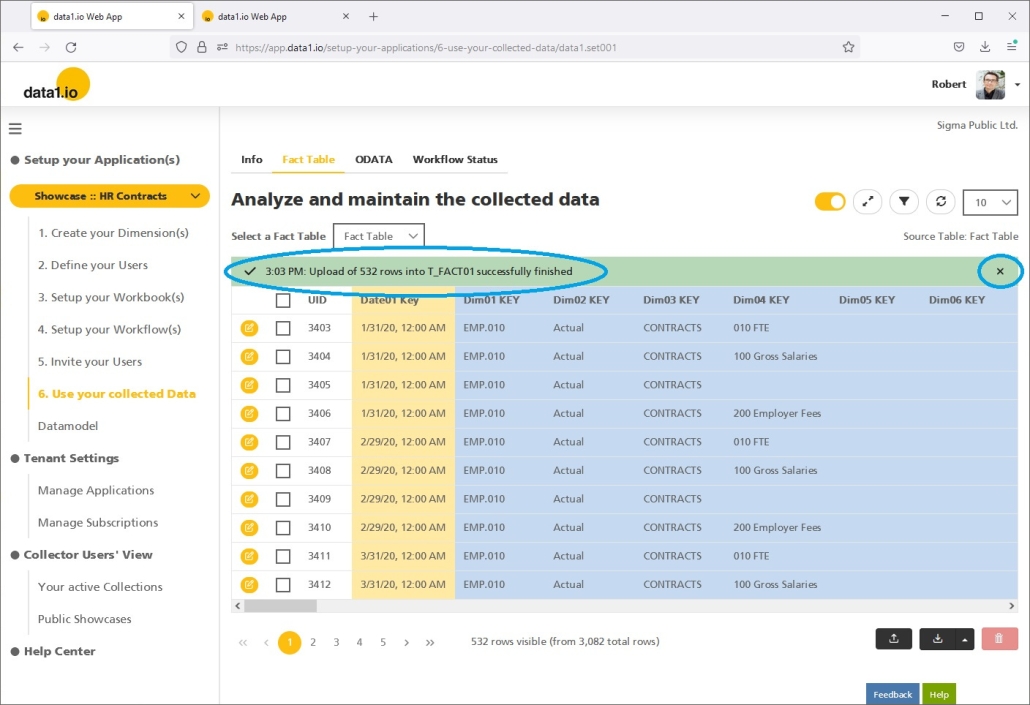
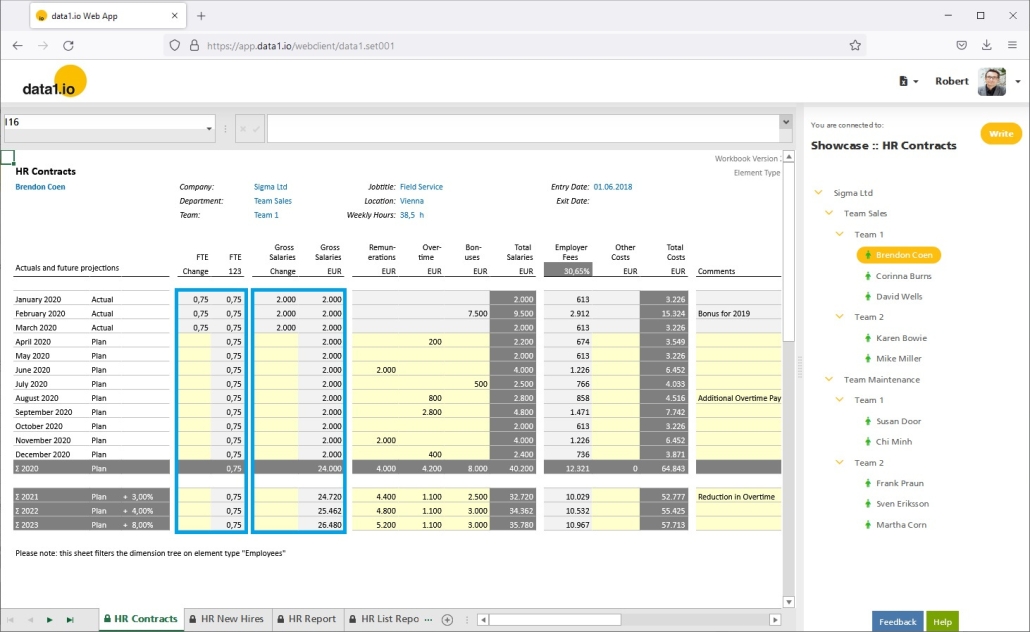
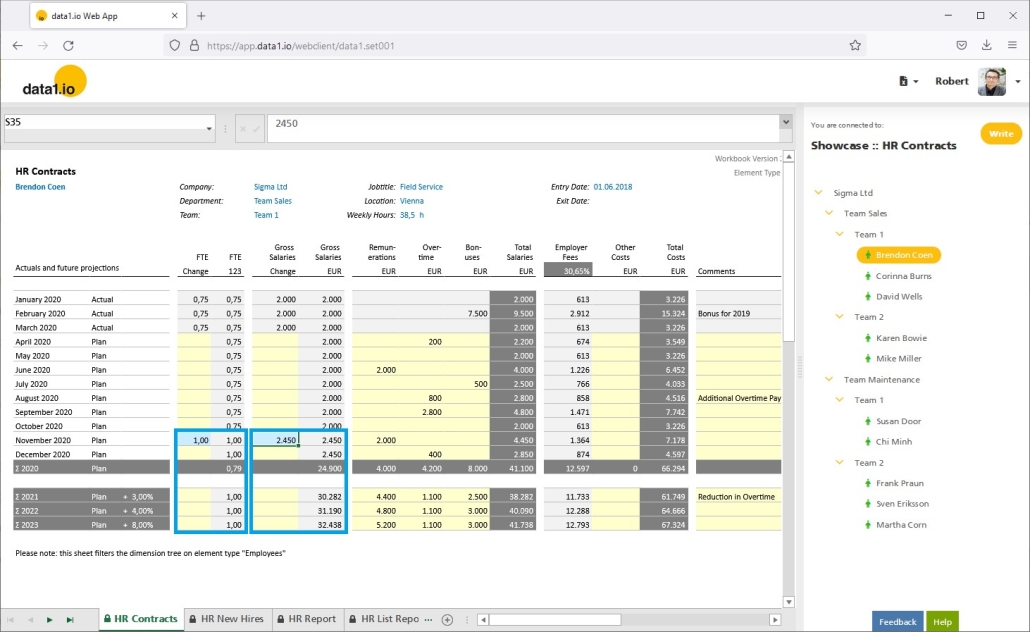
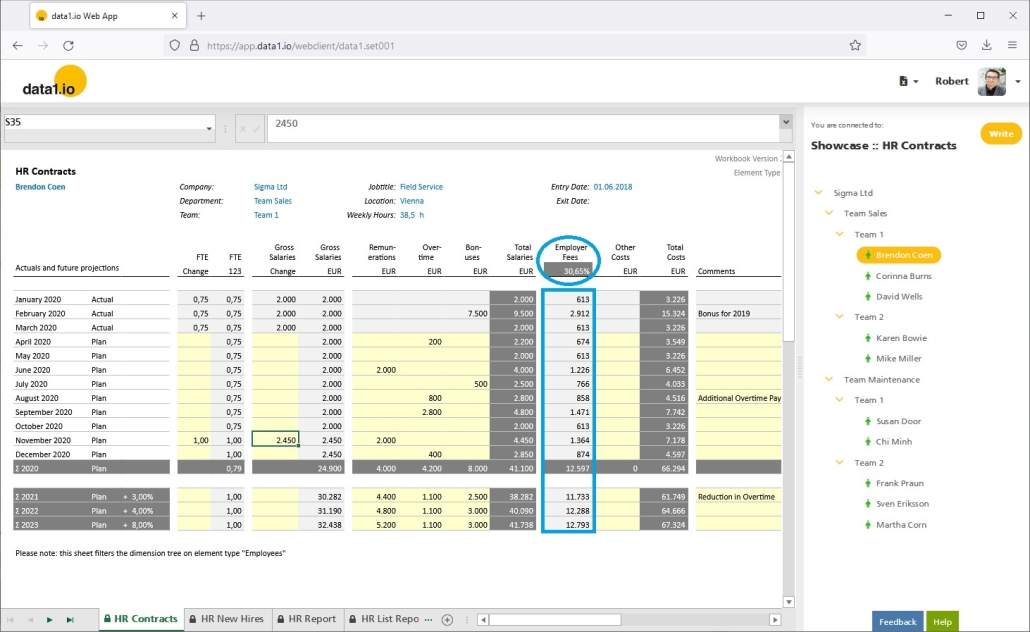
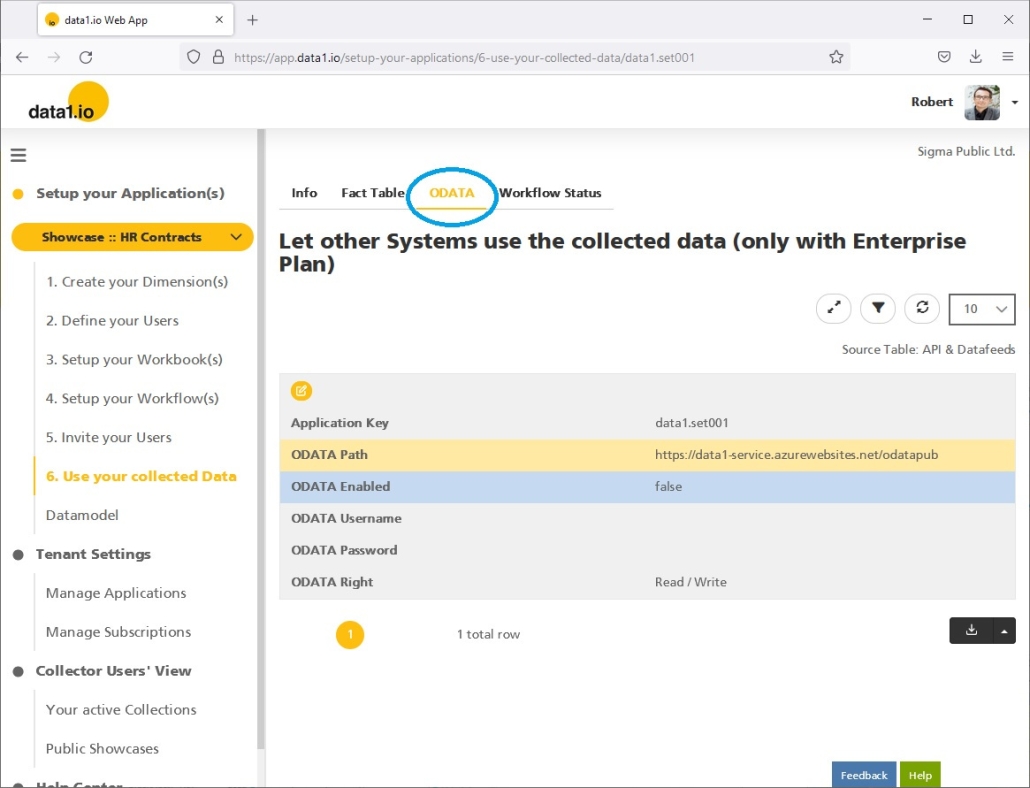
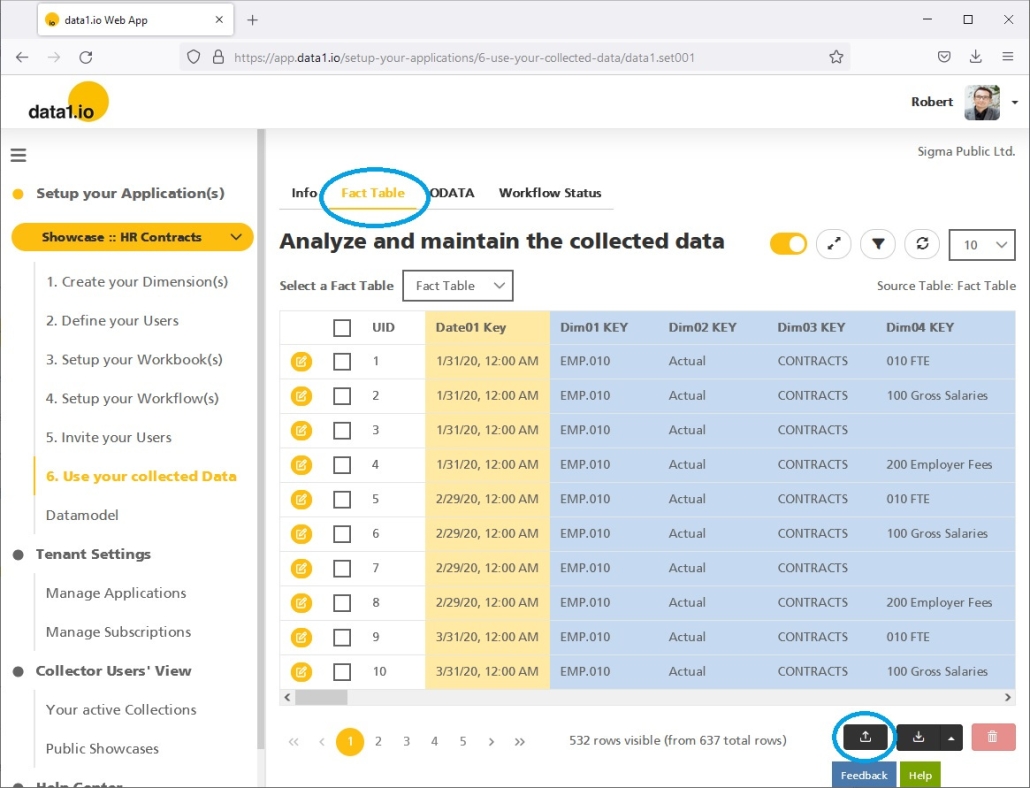
Remember, the Web Client is the user friendly spreadsheet for your Collector Users to deliver their monthly/weekly/daily data. The Web App is the tool for the Power User to setup and control your organization’s collection workflows.
(1) Web App: New workflow type “Continuous Workflow”
We are very happy to present a new workflow type: Continuous Workflows! The workflow type that we had to date is now called “Single Workflow”.
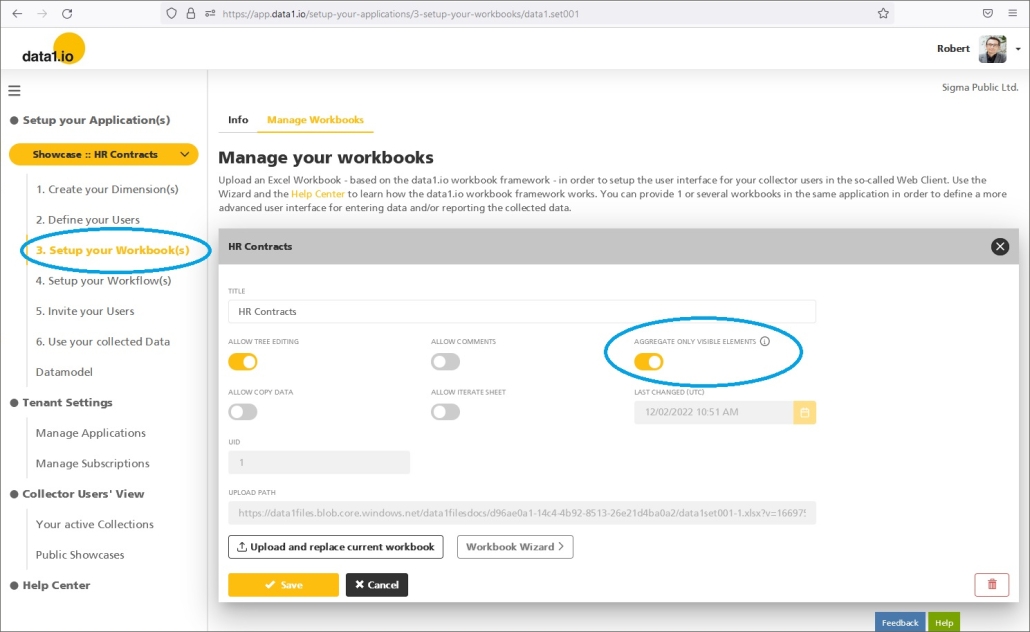
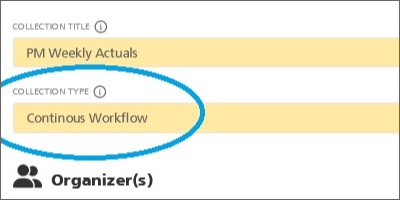
You can change now the workflow type …

… to “Continuous Workflow” then this workflow has no start and no end date any more. That means this workflow will be valid for an indefinate period of time.

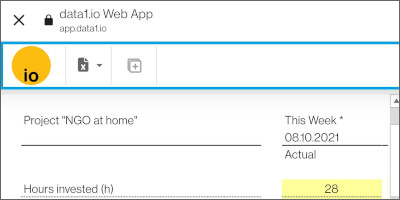
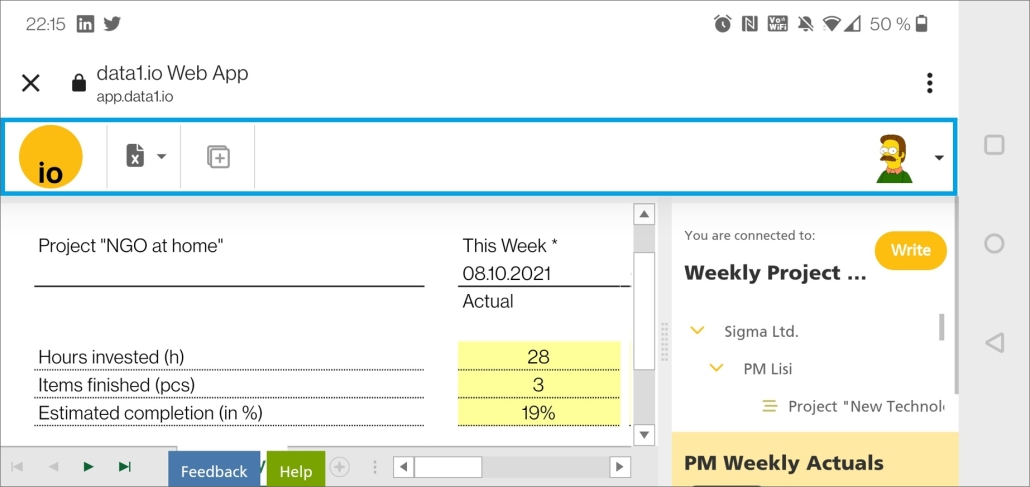
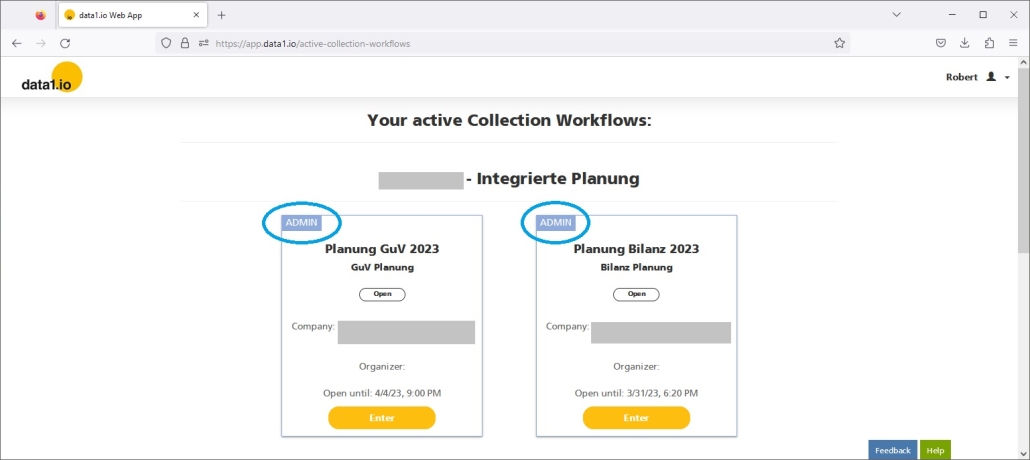
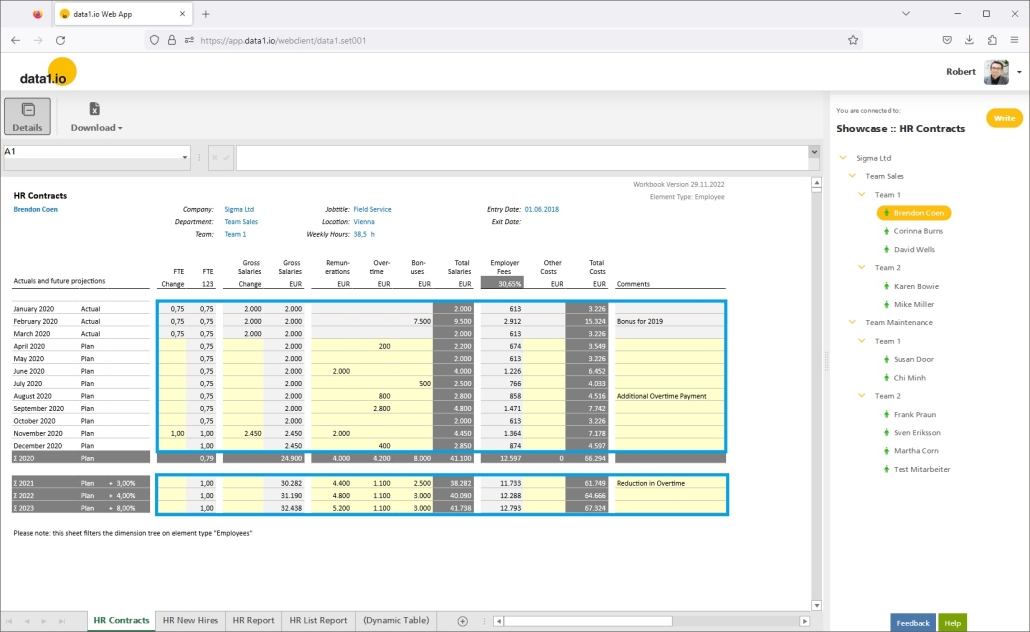
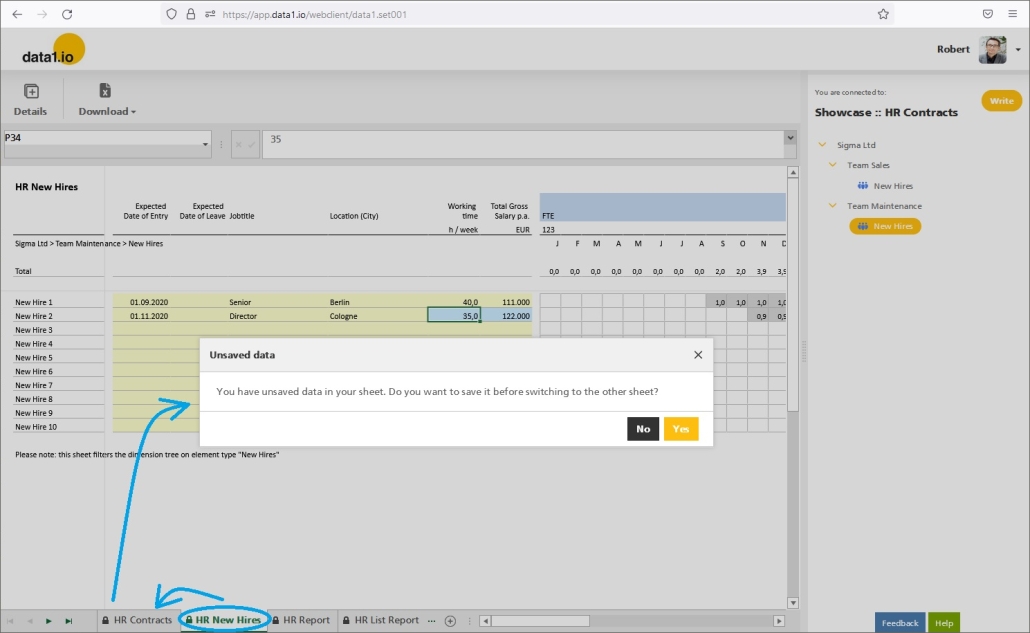
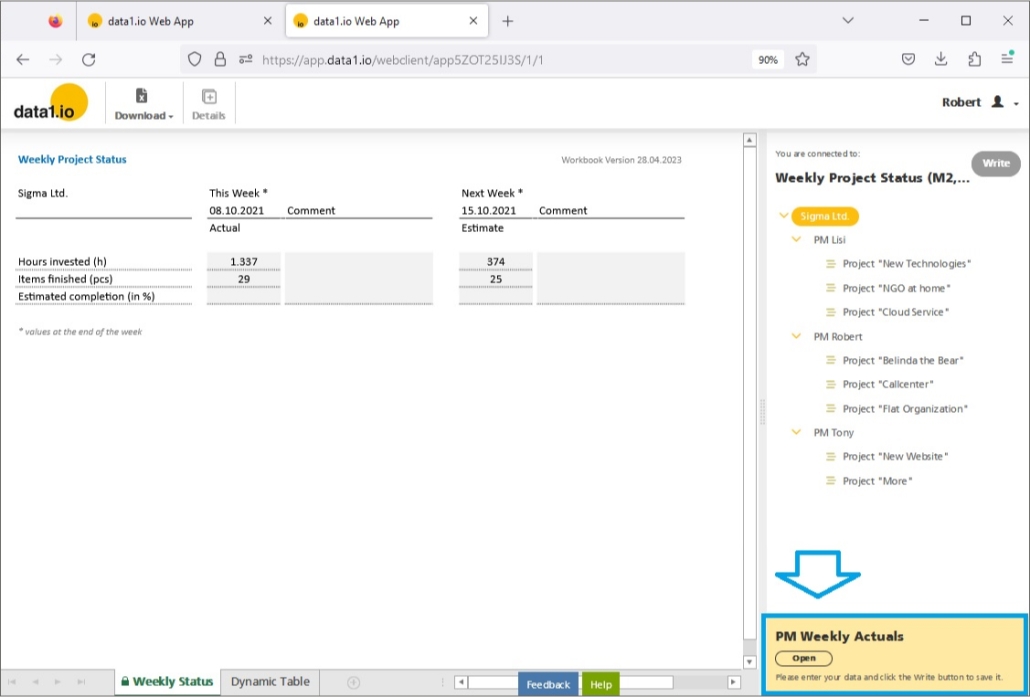
The workflow box in the web client does not show any validity date for the collector users and there is no “Finish” button:
(2) Web App: Configure the Finish button in “Single Workflows”
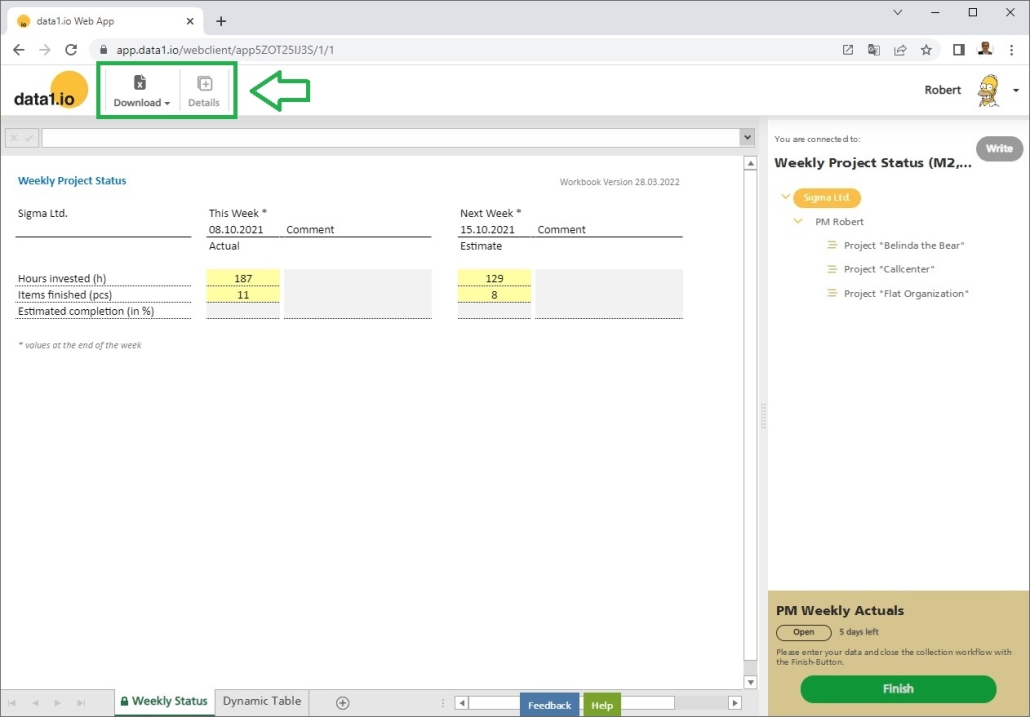
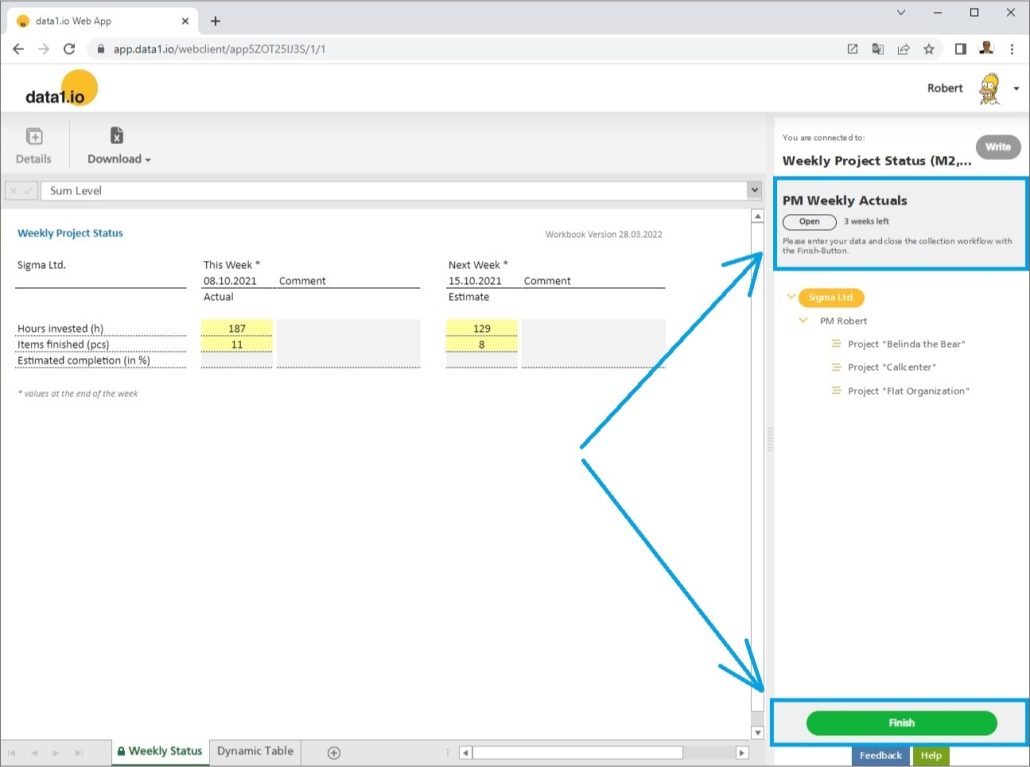
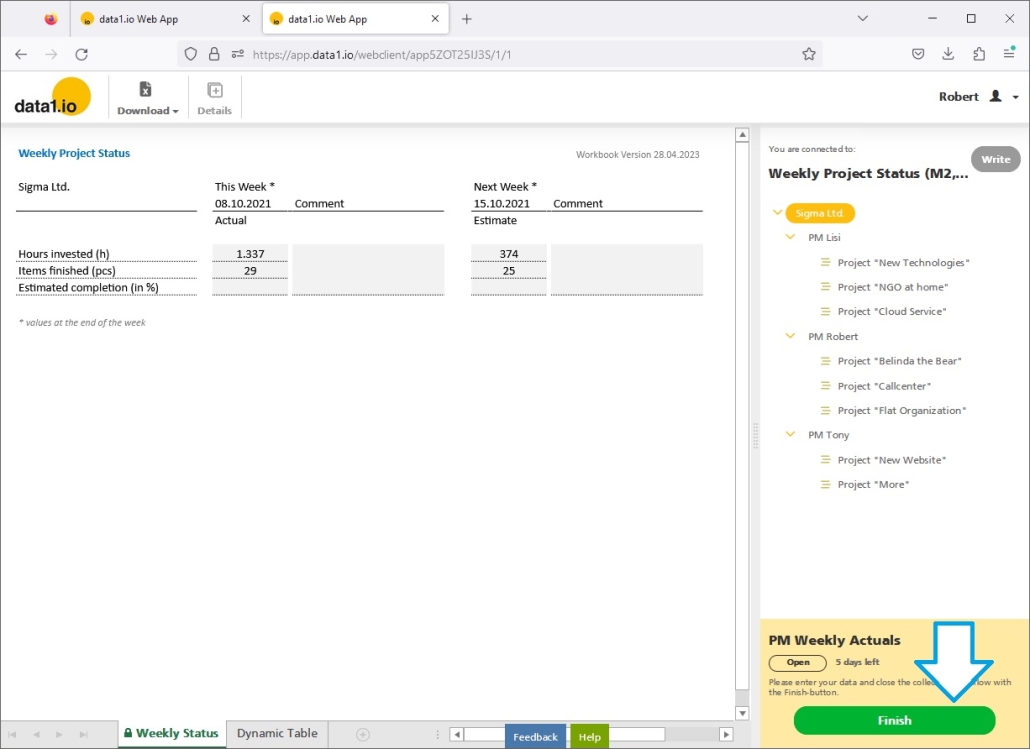
In the “Single Workflow” we had until now the mandatory “Finish” button:
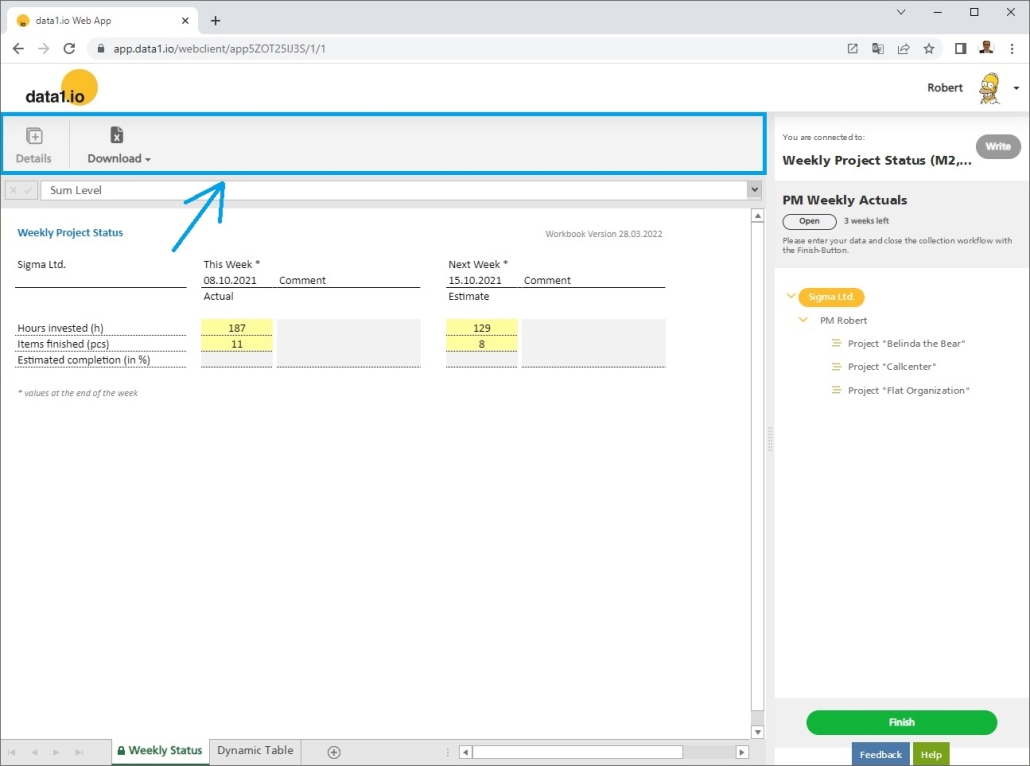
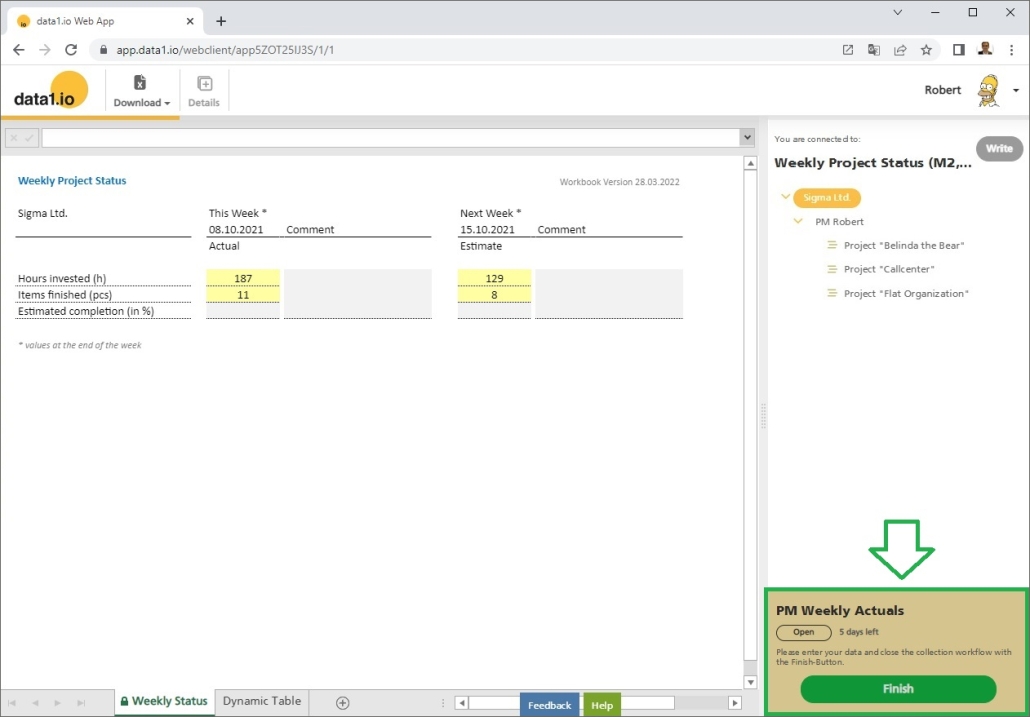
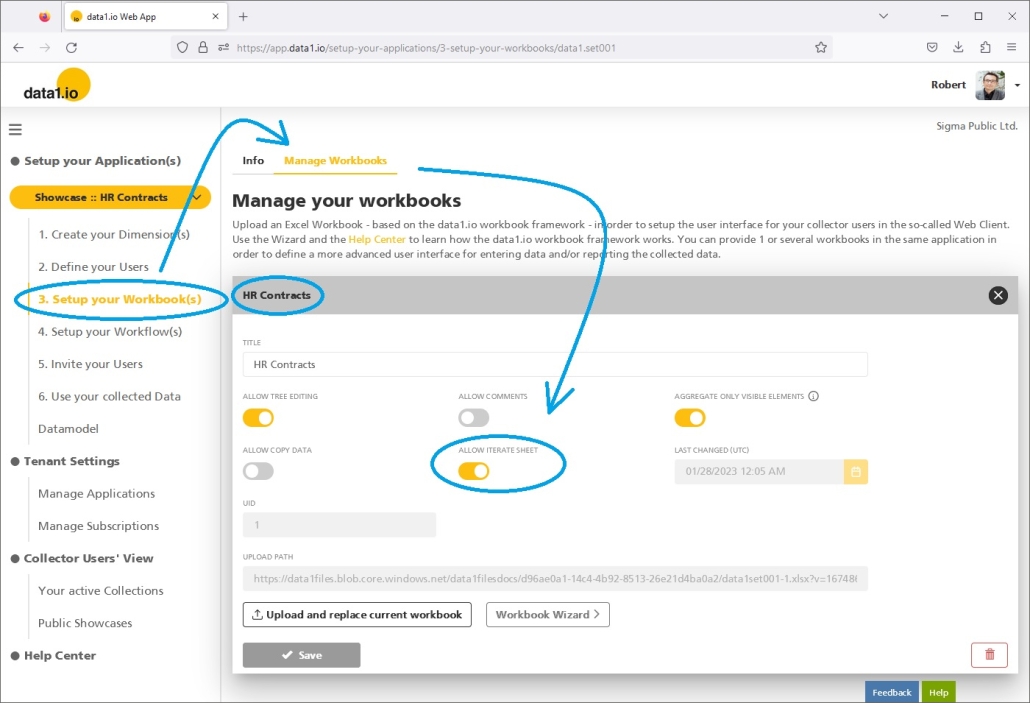
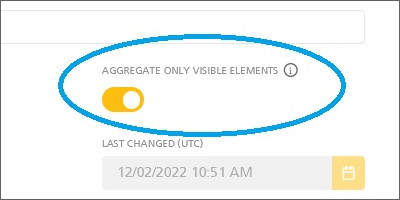
From now on, you can activate or deactivate the Finish button and furthermore you can also configure the message that is shown to your collector user in the workflow box:
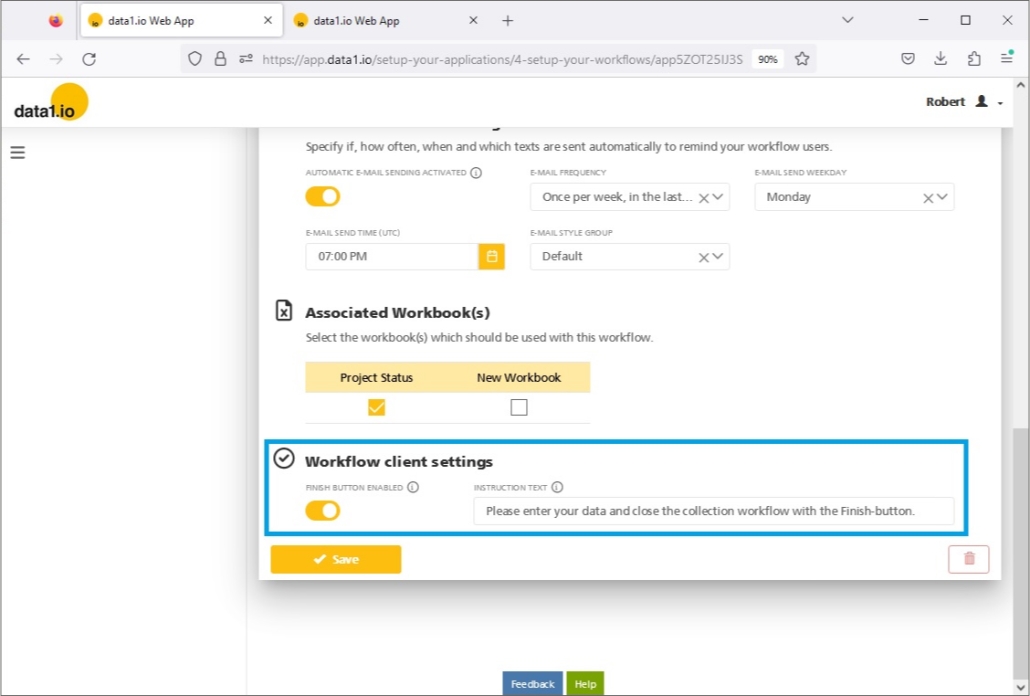
Please be aware that the user-specific “Collection Status” becomes irrelevant, if the Finish button is deactivated (the same is true if the workflow type is “Continuous Workflow”):

(3) Web App: Improvements for E-Mail Notifcations
We happy to present the new “E-Mail Send Weekday” option:

Furthermore we have moved the activation / deactivation button for the E-Mail Notifications from the “Invite your users” section directly into the workflow settings (since this is much more intuitive):

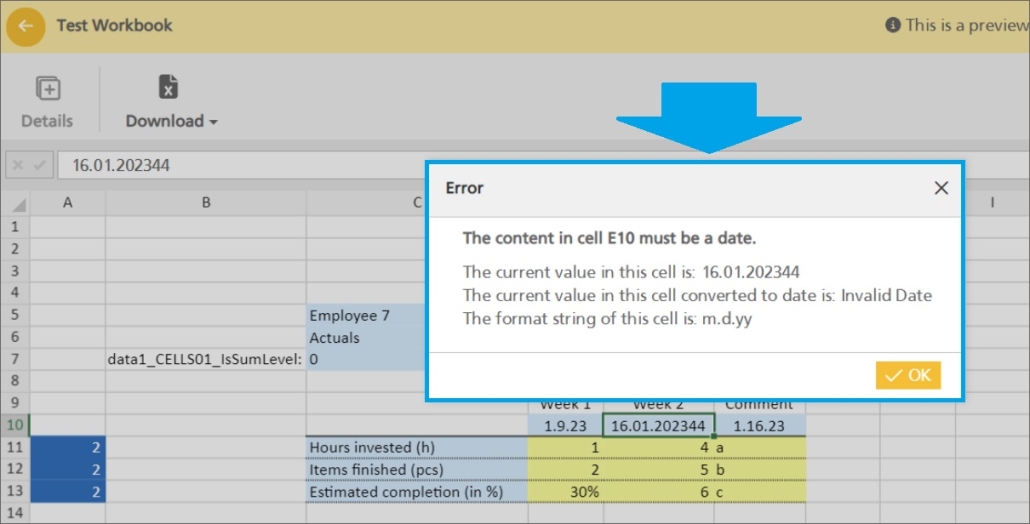
(4) Web Client: Definition of mandatory entries
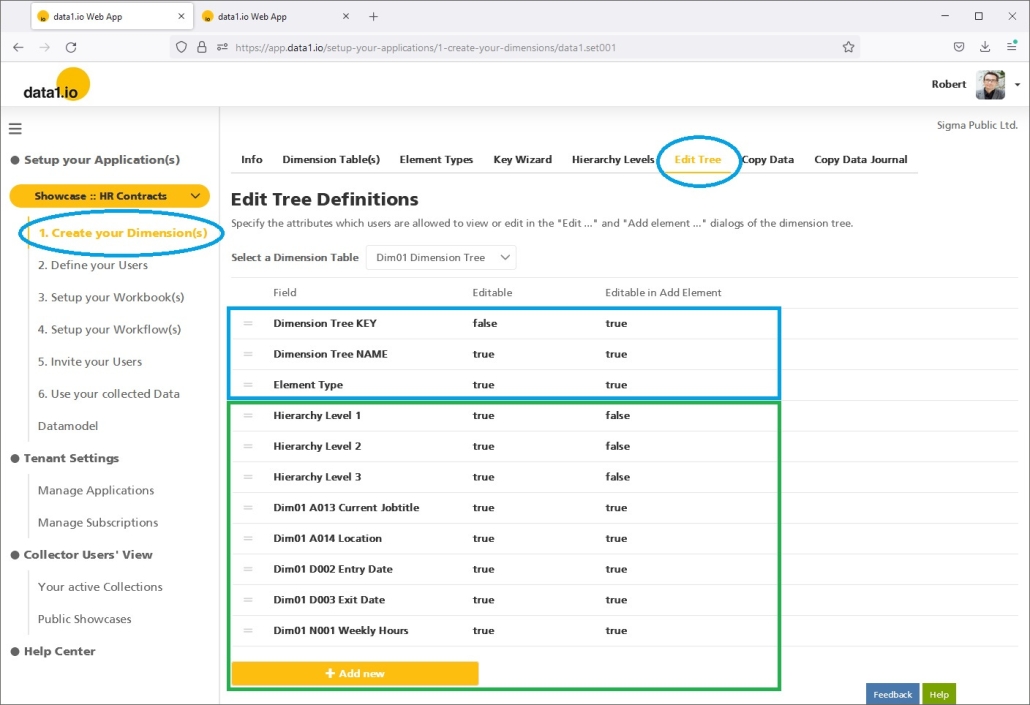
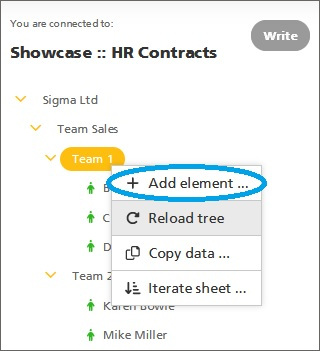
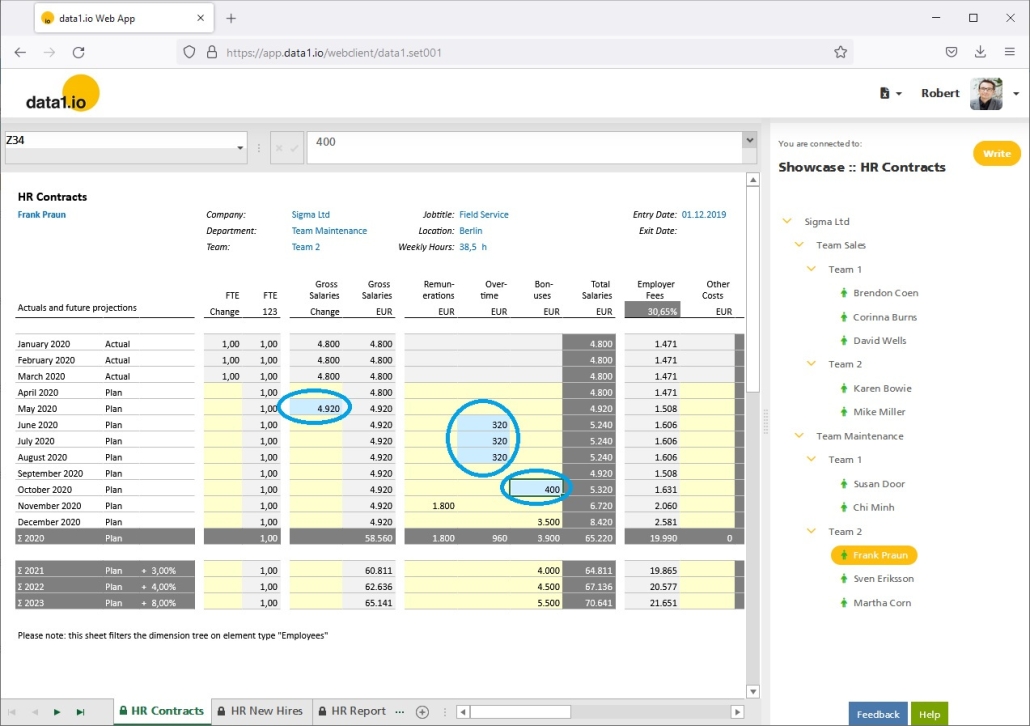
Another important new feature is the definition of mandatory entries like this:
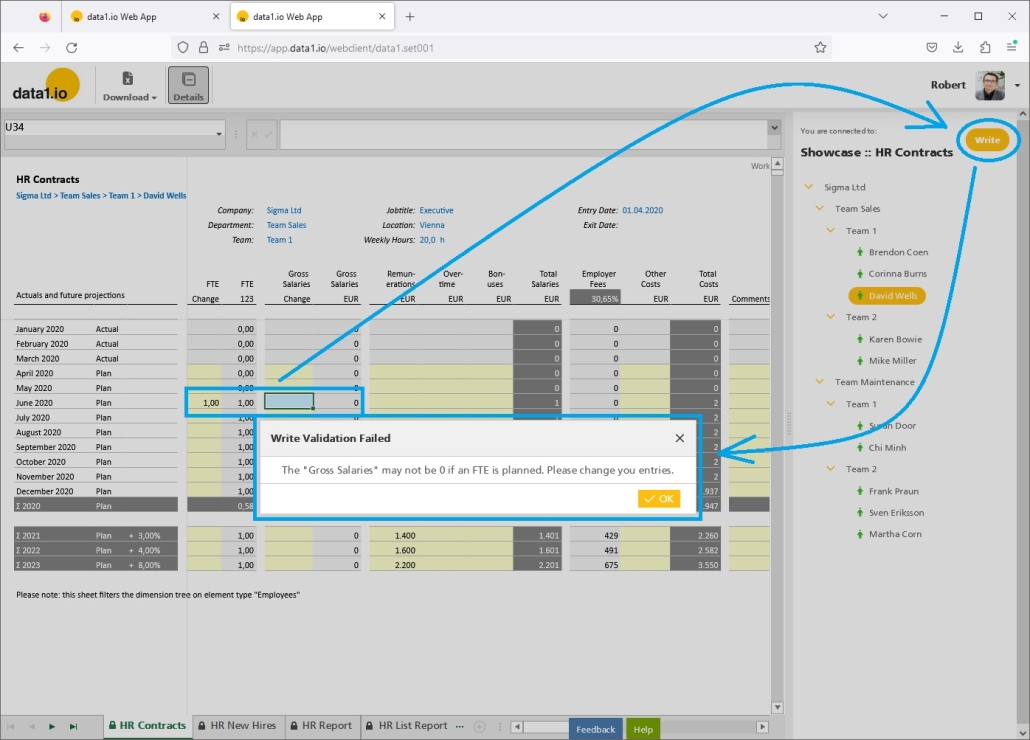
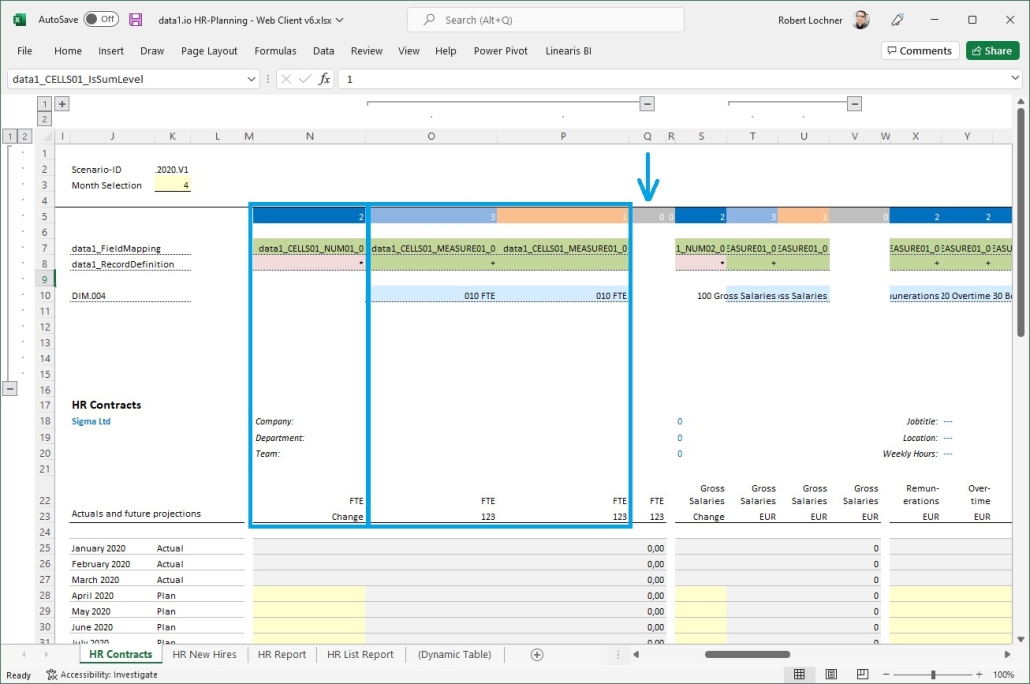
It is very easy to use. Just define the following 2 parameters (= named ranges) in your workbook:
- data1_Write_Validation
0 = default = Writeback is open
1 = Writeback is blocked - data1_Write_ValidationMessage
Use this parameter to define the message for the user, which is displayed if the first parameter has value “1” and the Write button is pressed.
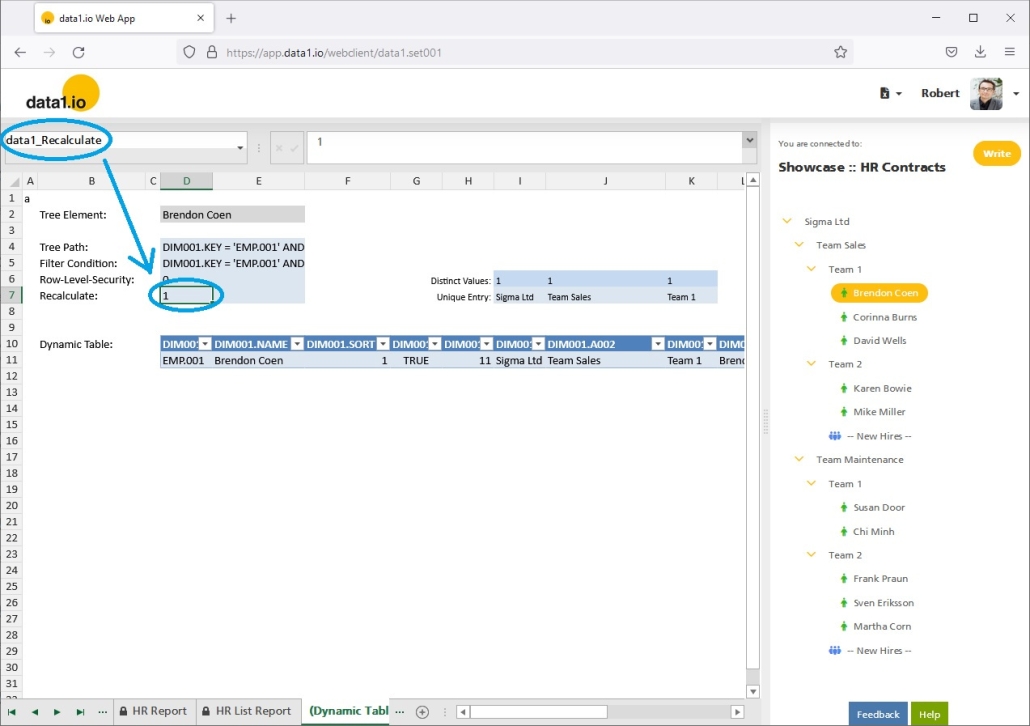
You can simply control the write validation by generating a “1” on the first parameter via a formula which is referenced to the validation rules in your individual workbook:
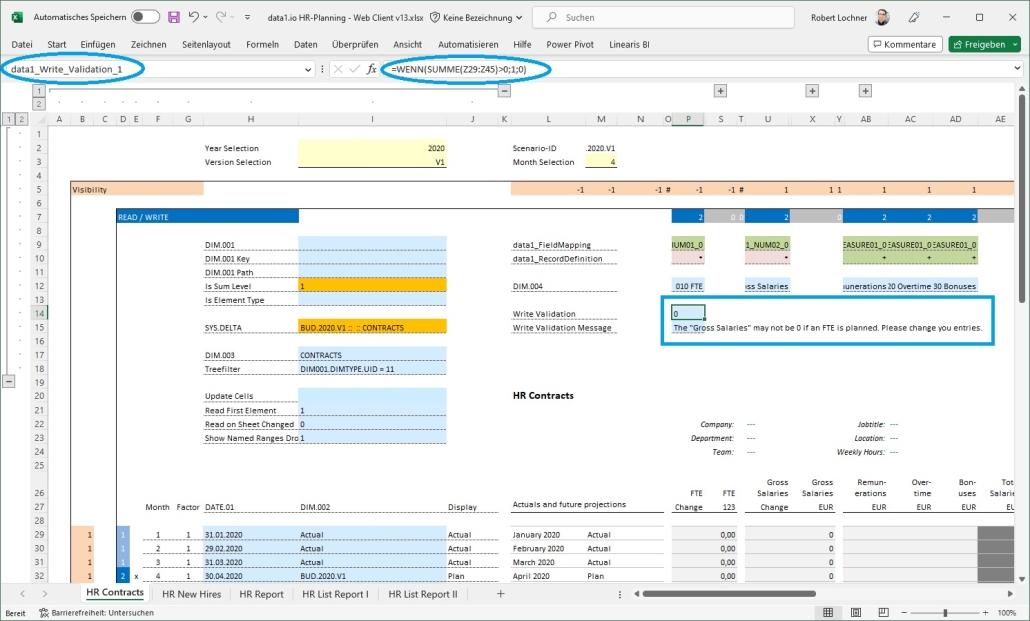
Furthermore you can define as many write validation “couples” in your workbook as you like:
data1_Write_Validation_1
data1_Write_ValidationMessage_1
data1_Write_Validation_2
data1_Write_ValidationMessage_2
(5) Web Client: Group By for ListQueries
The ListQuery feature was introduced in the February 2023 release and was improved in the March 2023 release and in the April 2023 release.
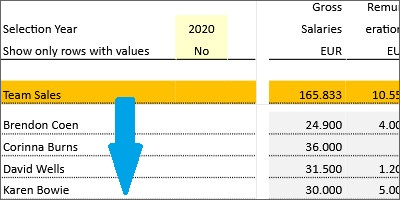
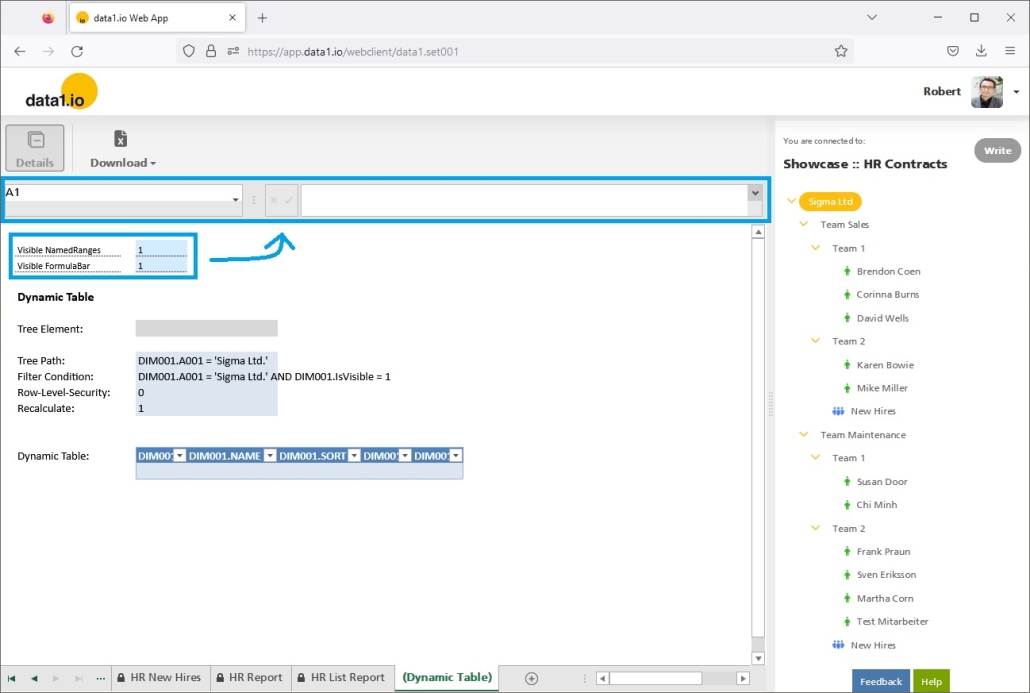
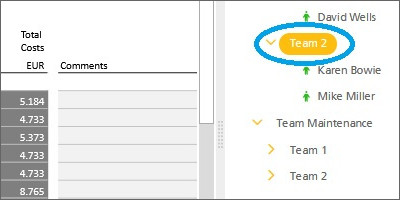
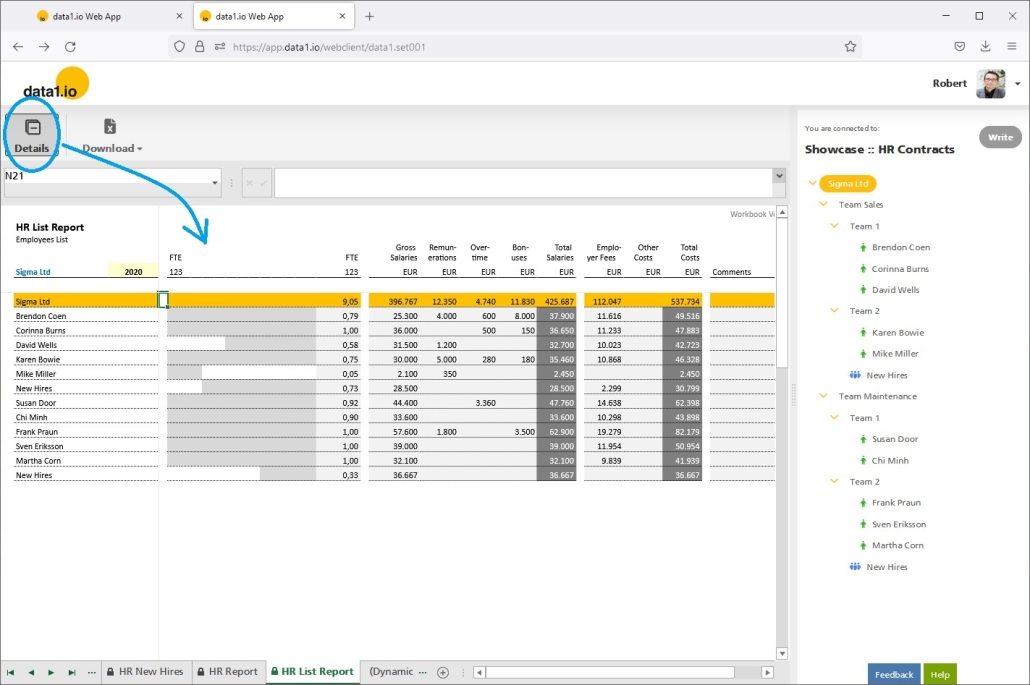
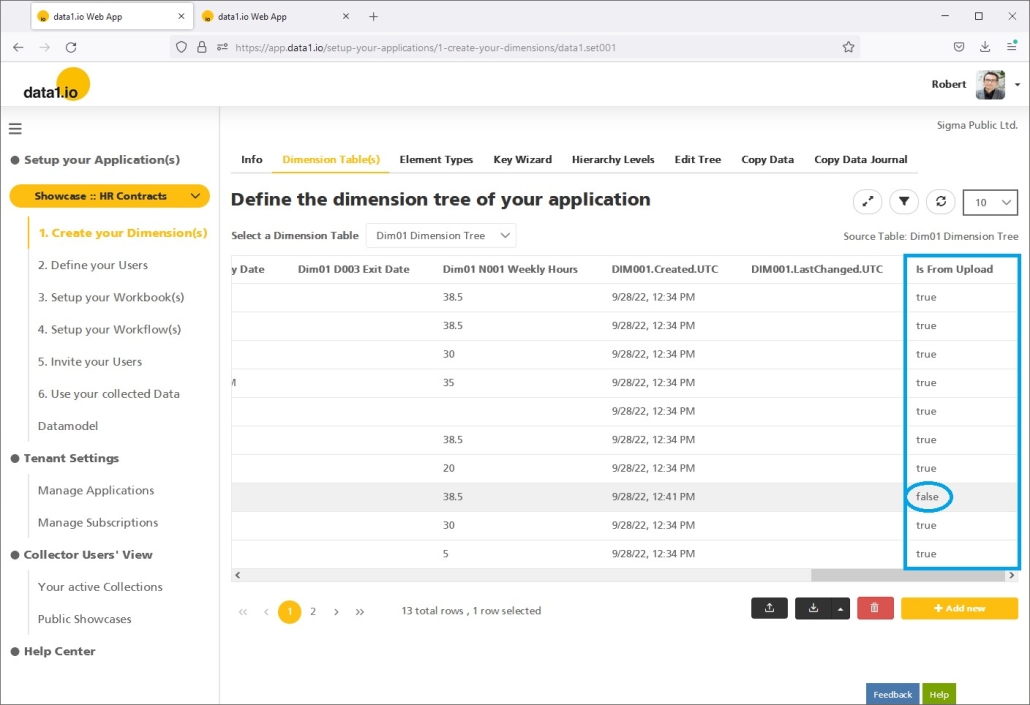
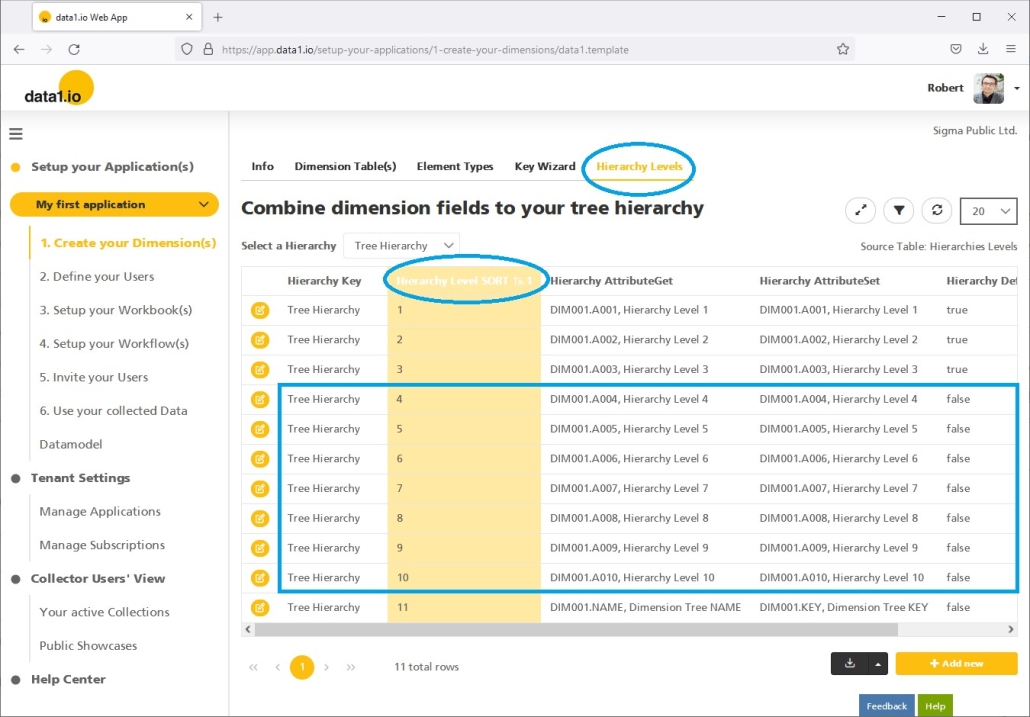
Until now, it was only possible to define a ListQuery on the bottom level of a dimension table like this:

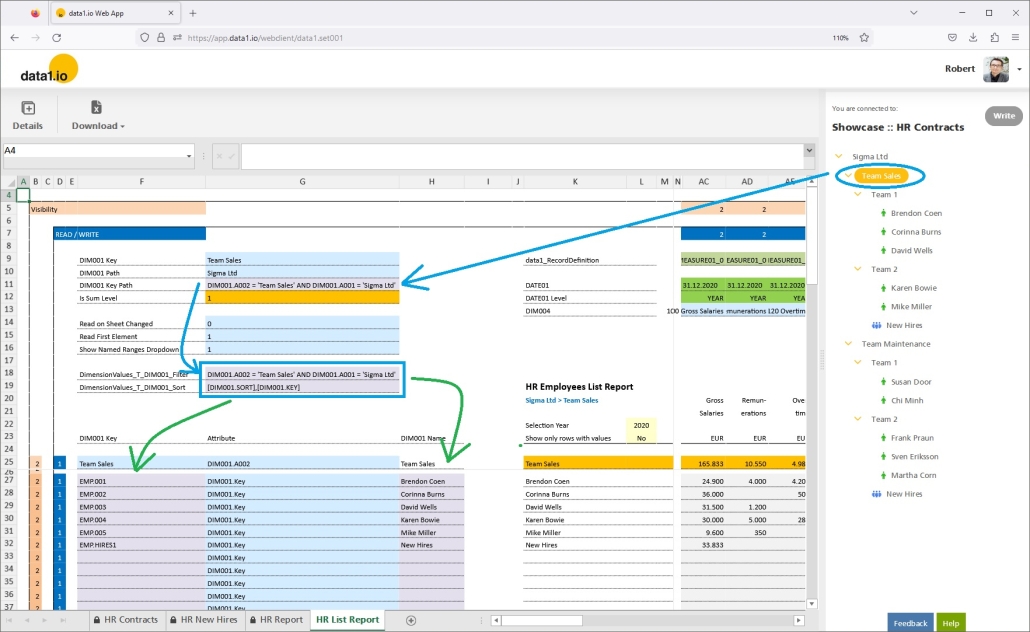
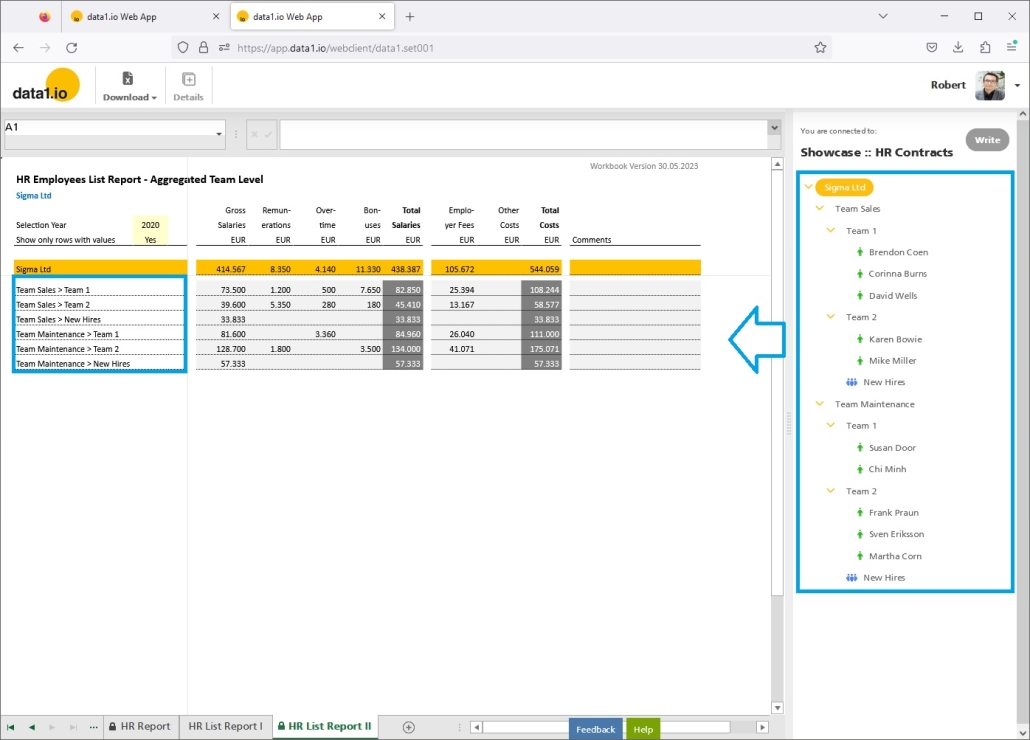
With the new Group By Feature it is possible to define a ListQuery also on an aggregated attribute in the dimension table like this:
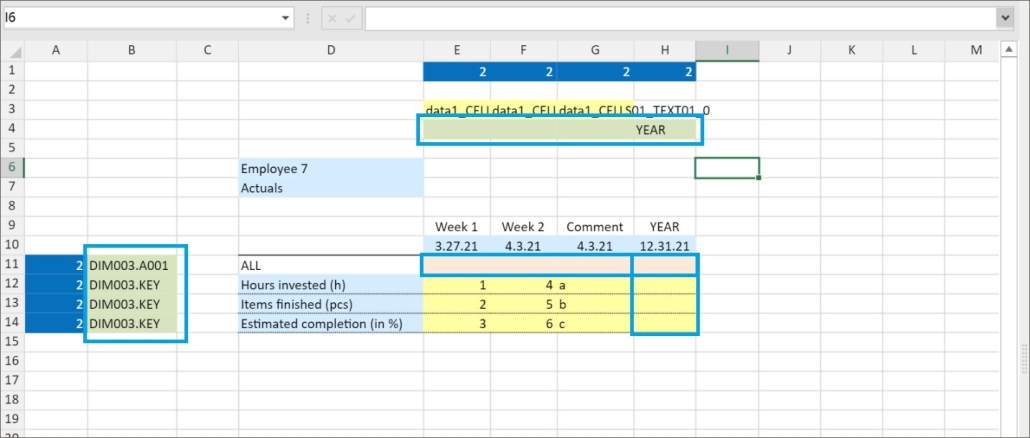
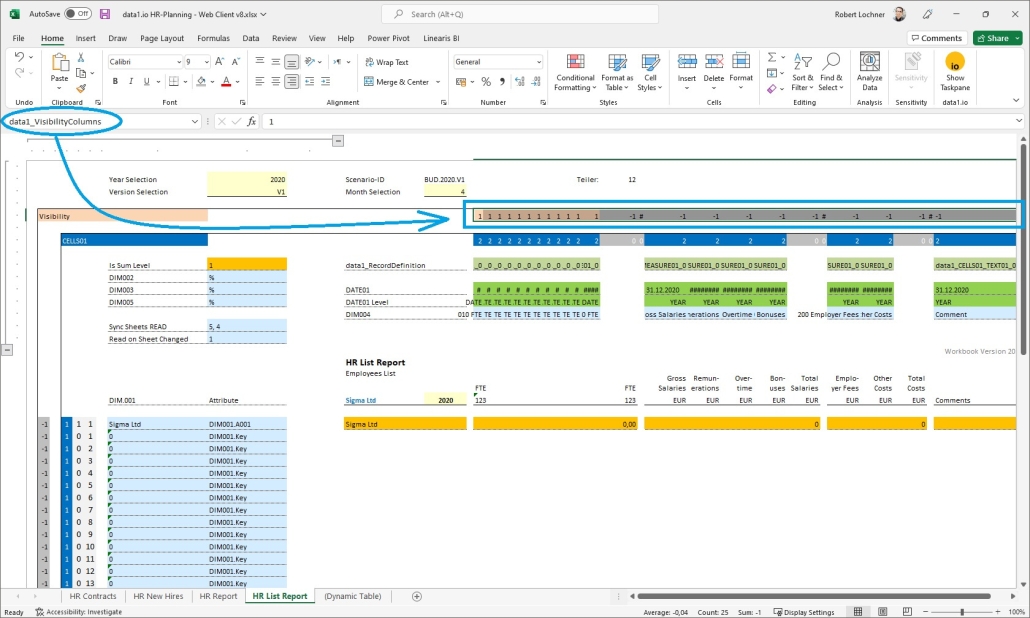
The feature is activated with the new parameter (= named range) “data1_CELLS01_DimensionValues_T_DIM00x_GroupBy”:
- 0 = default = bottom öevel (no group by)
- 1 = aggregated level (group by)
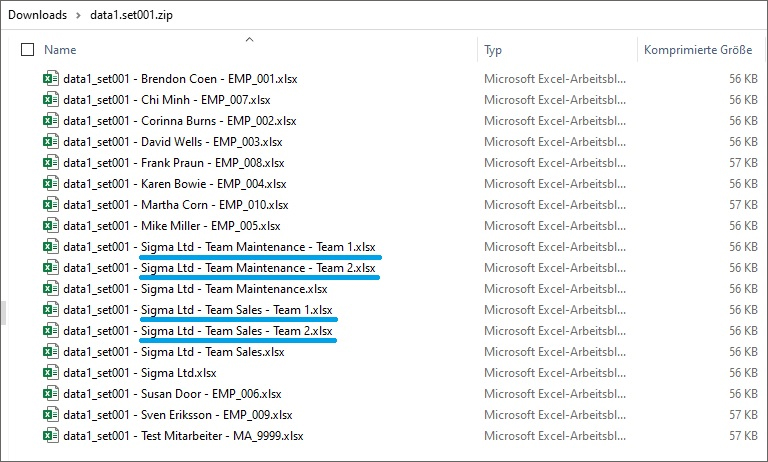
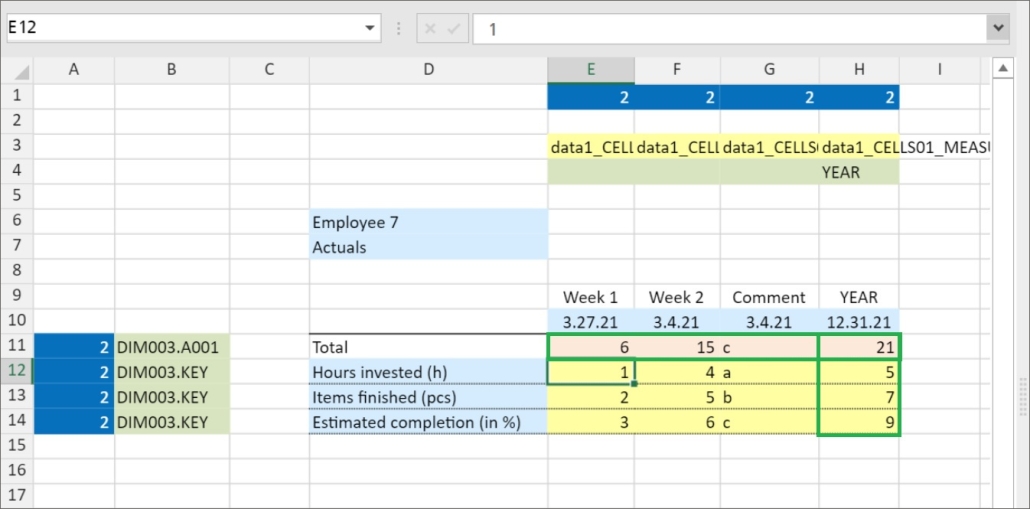
This GroupBy parameter causes all “output parameters” (here on Attribute 15) to deliver grouped lists:
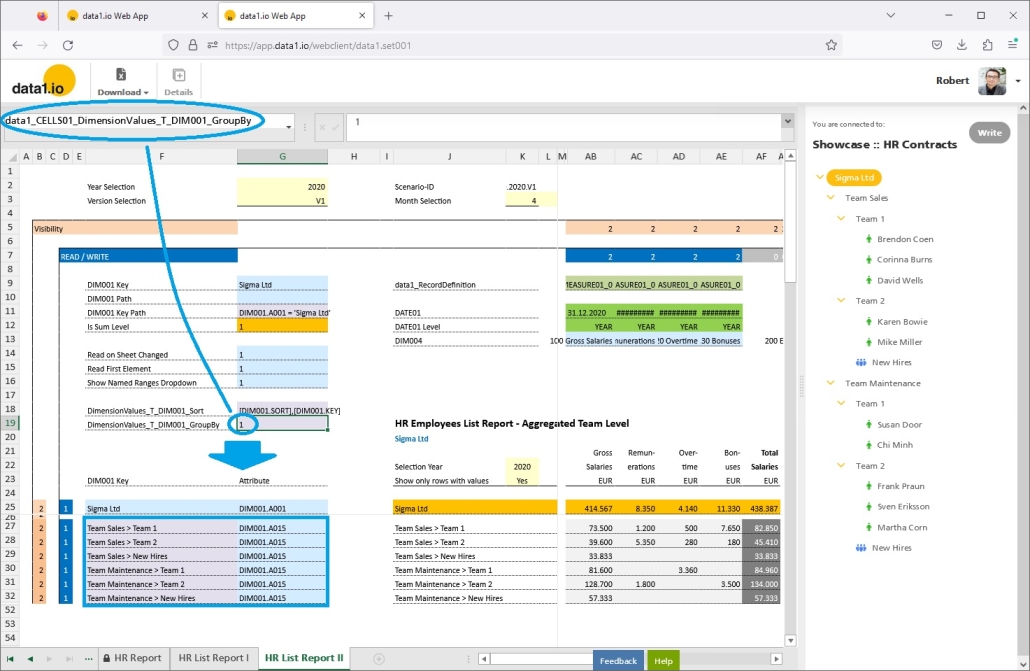
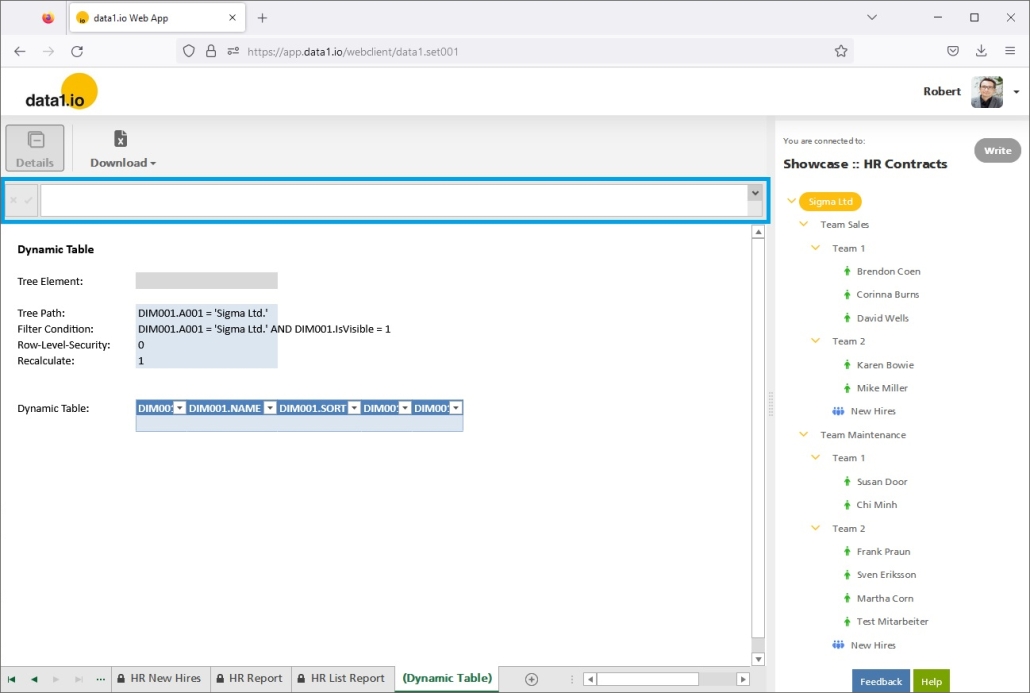
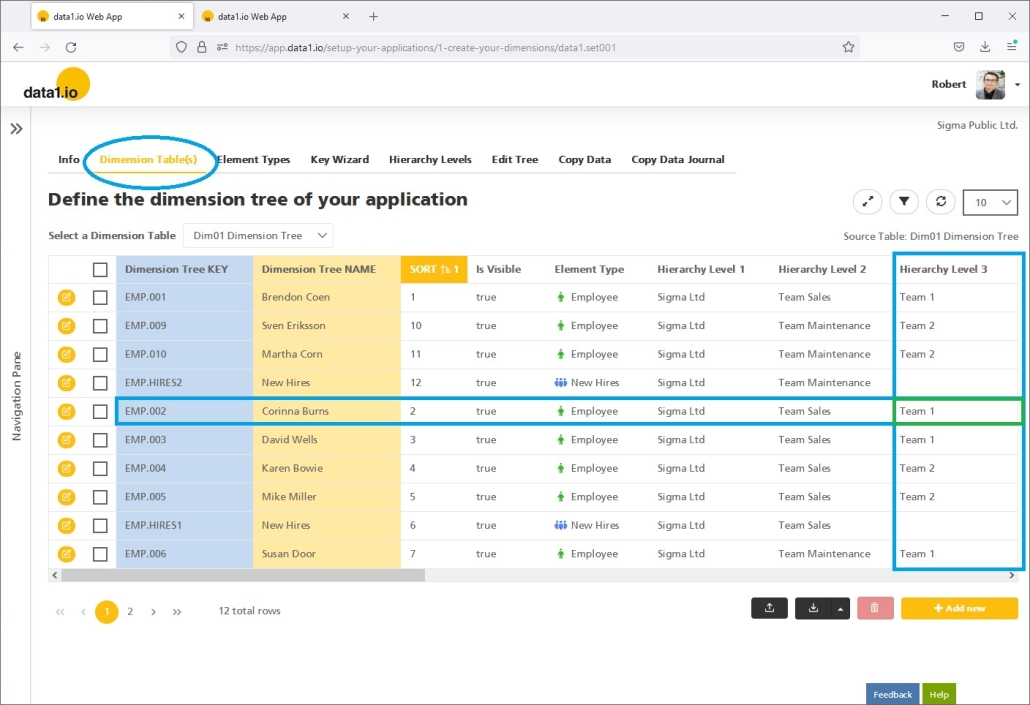
Compare the grouped list above with the dimension table itself:

(6) Web Client: Show workflow box also after validation date
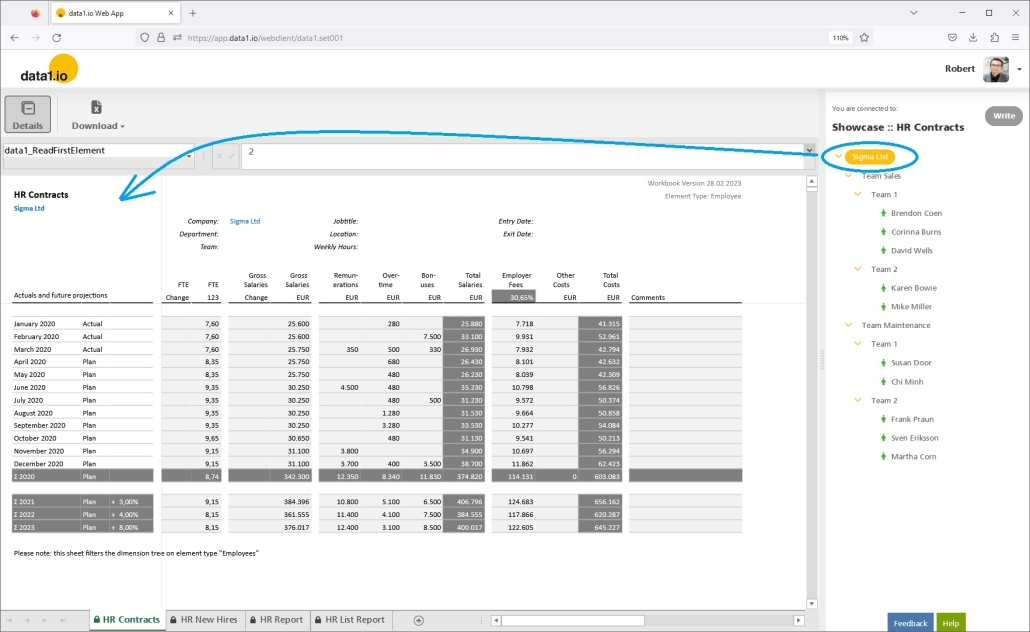
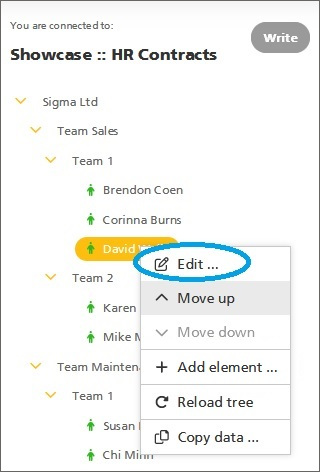
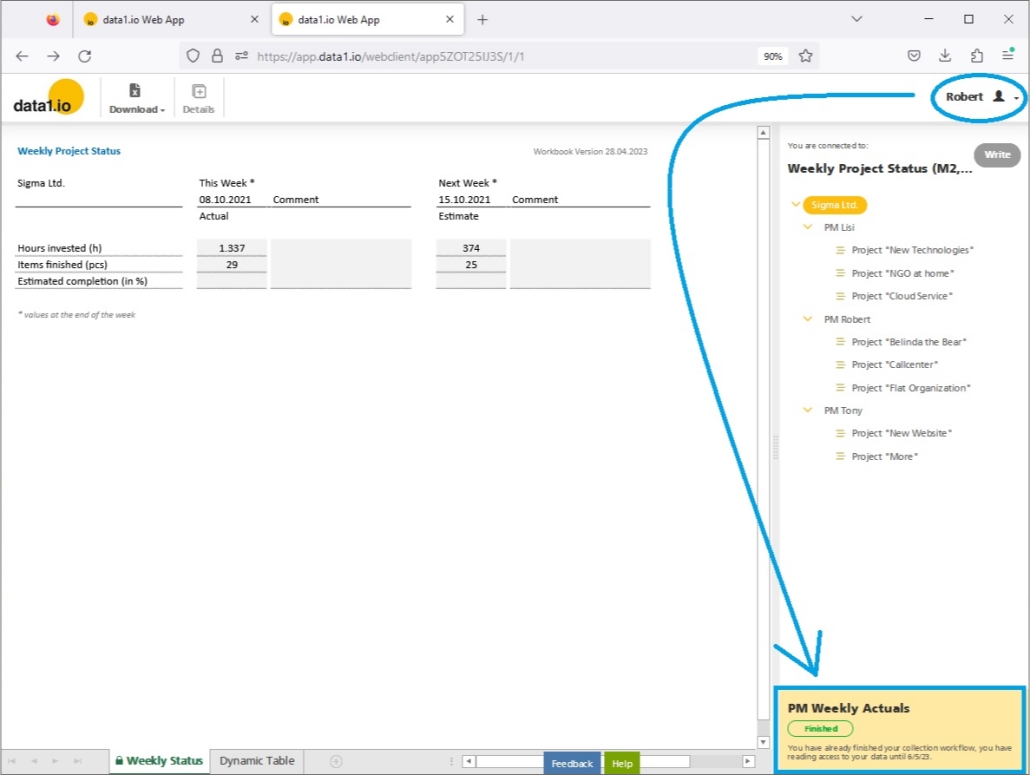
Until now, the organizer of a workflow and its deputy …
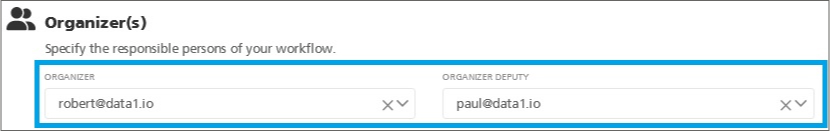
… did not see the workflow box in the Web Client after the validation date of a workflow (type “single”) – all other collector users did seet it. This is fixed now, so that also the organizer and the deputy can see the workflow box:
(7) Technical Improvements and debugging
We have solved a bunch of issues:
- Troubles with E-Mail Notifications since SendGrid changed the verification rules for senders on May 1st 2023
- New Write Button: performance issue with the check of writeable values in large sheets
- New Write Button: activation/deactivation also in real time (on formula result changes)
Hope you like the new features – we are very curious about your feedback!
Please let us know what you think and what kind of collection processes you would prefer to automate with data1.io.
Stay healthy and we #StandWithUkraine