Release May 2024
We are happy to deliver the brandnew May 2024 release with the new Multiple Layouts and many more! Try it now!
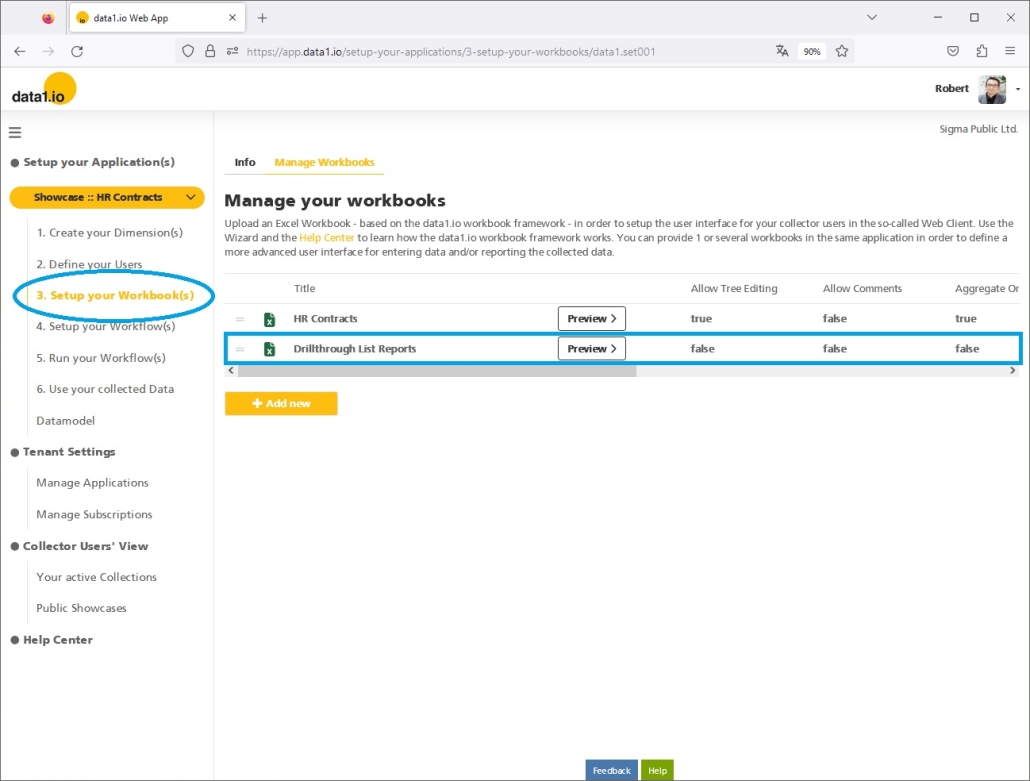
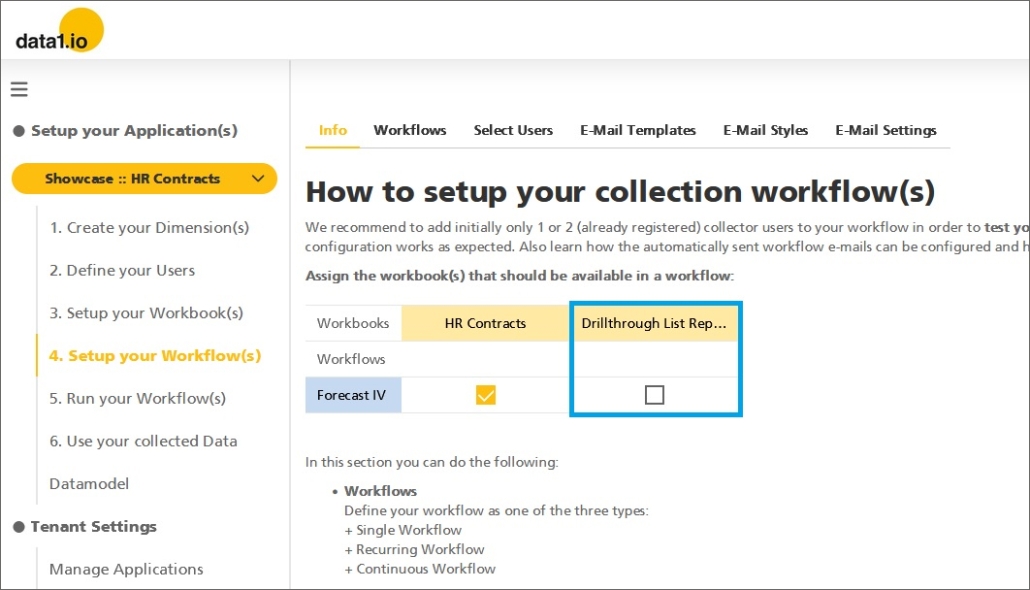
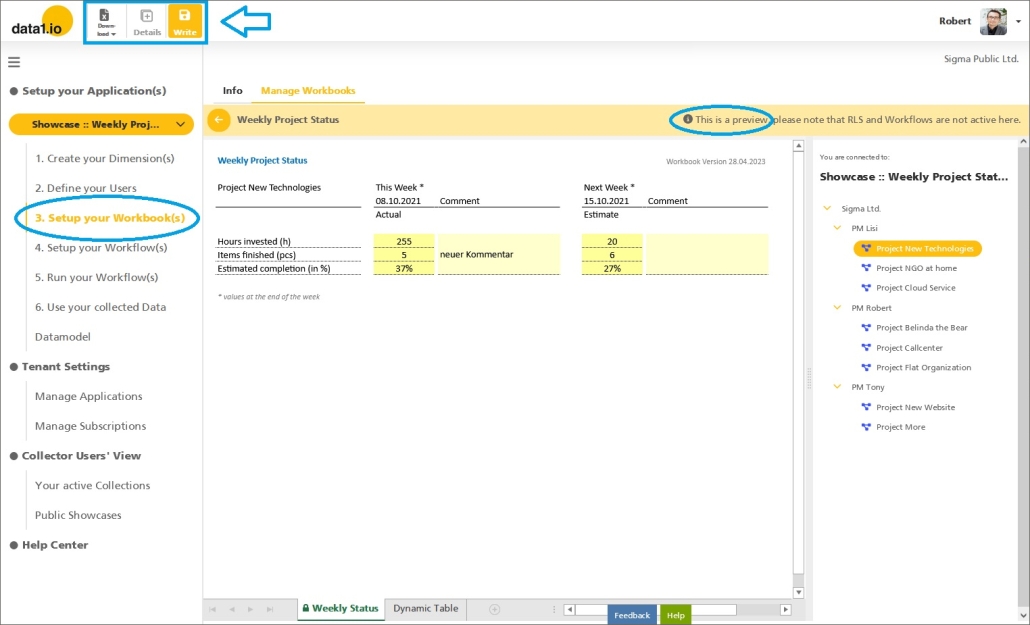
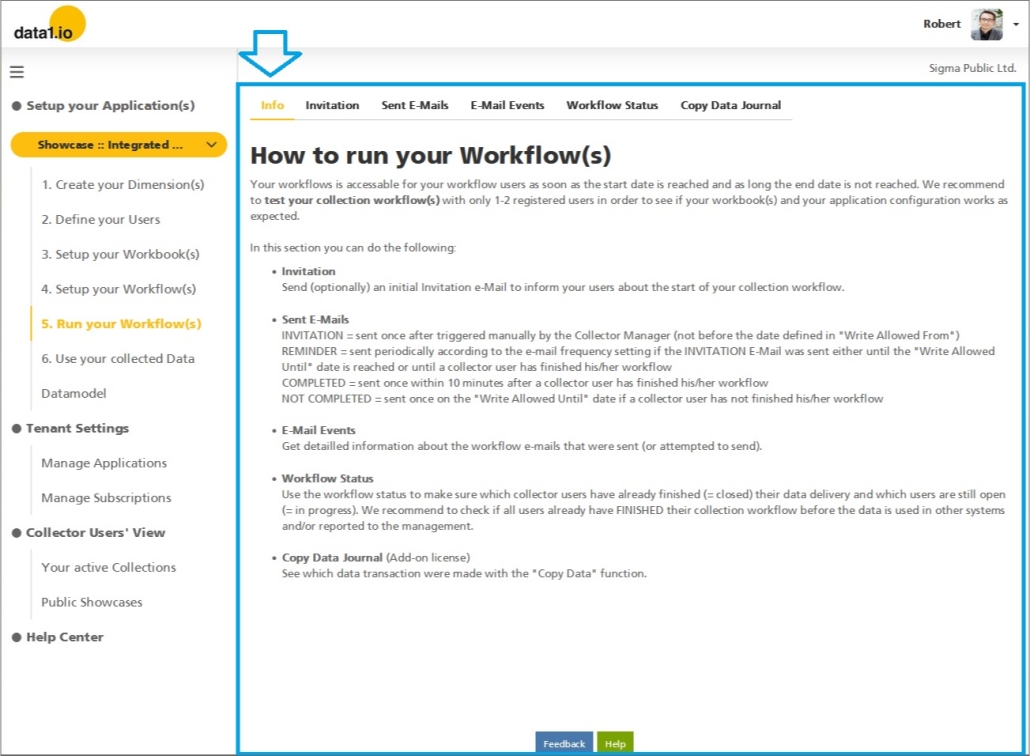
Remember, the Web Client is the user friendly spreadsheet for your Collector Users to deliver their monthly/weekly/daily data. The Web App is the tool for the Power User to setup and control your organization’s collection workflows.
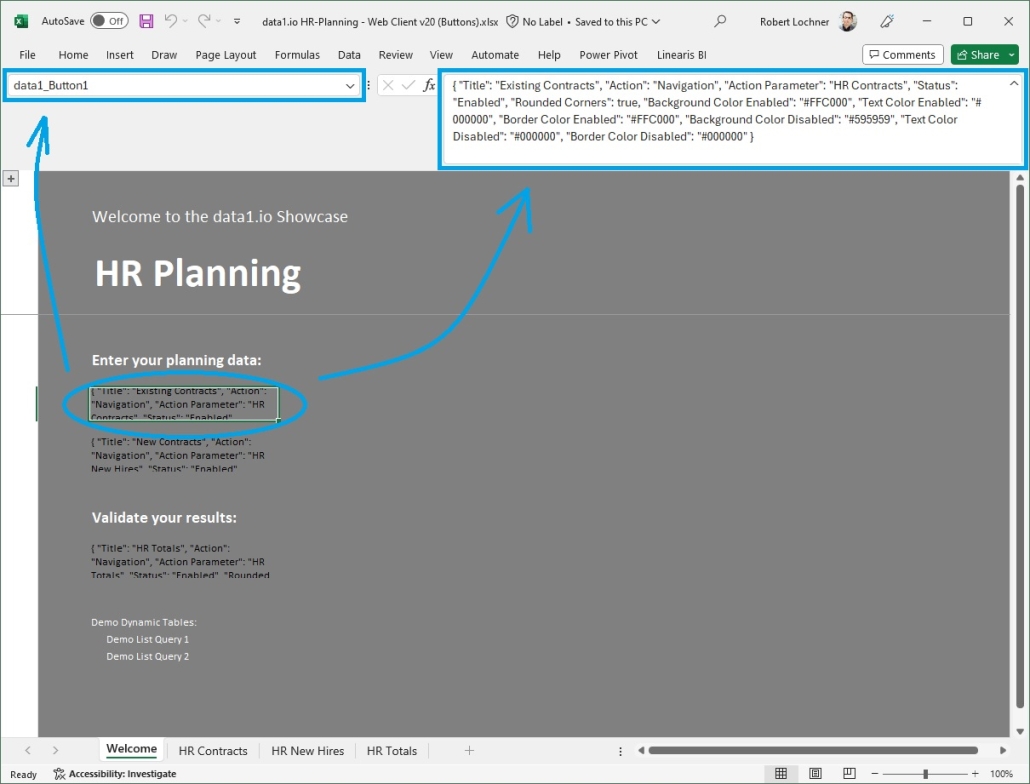
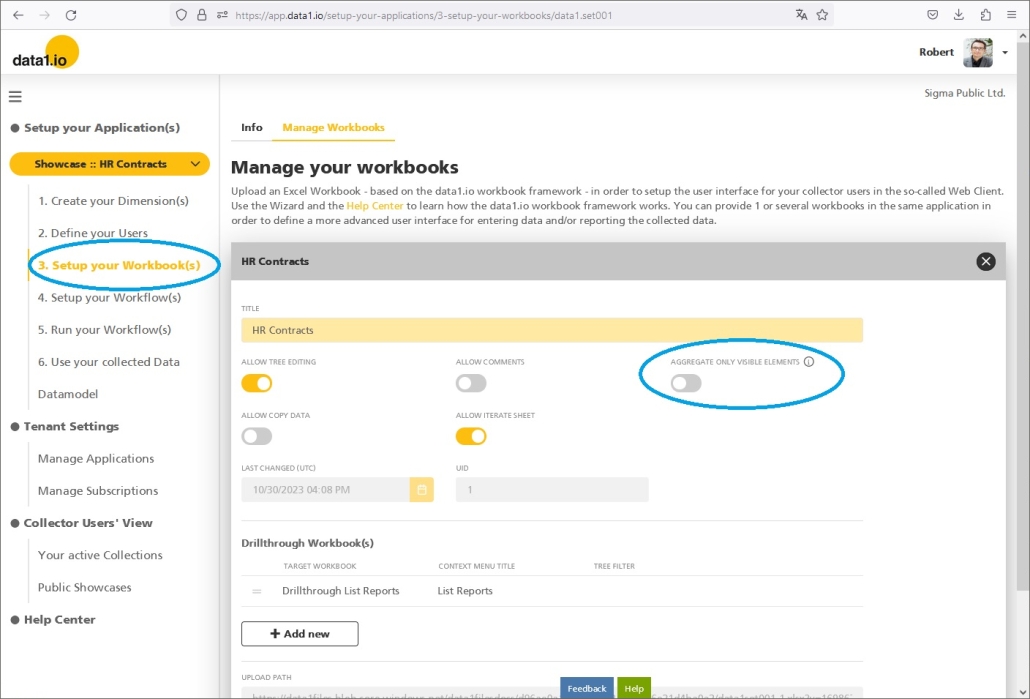
(1) Web Client: New Multiple Layouts with CELLS02
Until now, in data.io Workbooks only one data entry area per sheet could be defined (done with “CELLS01” named ranges). With this release, in the same sheet a variable number of data entry areas can be defined (CELLS02, CELLS03, etc.).
a. Fields of application
This new function makes many new usecases for planning, data collection and also reporting possible:
- Collecting different types of information within the same sheet (e.g. blocks with different types of metrics, blocks for cost and invest, etc.)
- Collecting values on a bottom level (e.g. single accounts) and collecting comments on a top level (e.g. subtotal lines)
- Showing comparison data from the last forecast / budget / last year in the current period
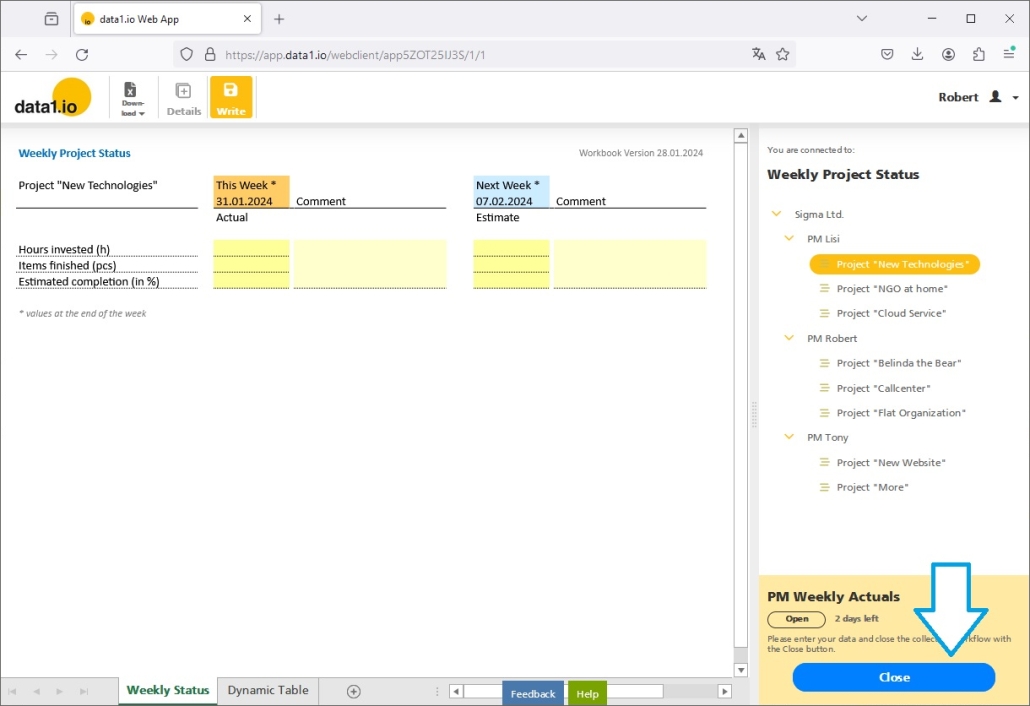
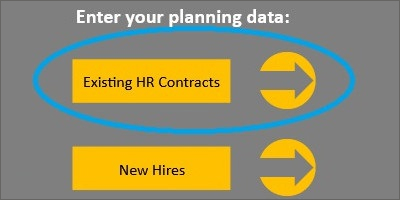
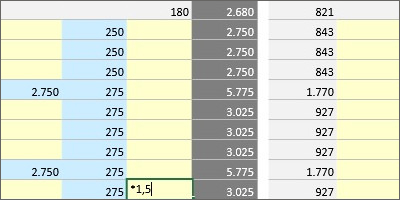
b. Example – Data Entry
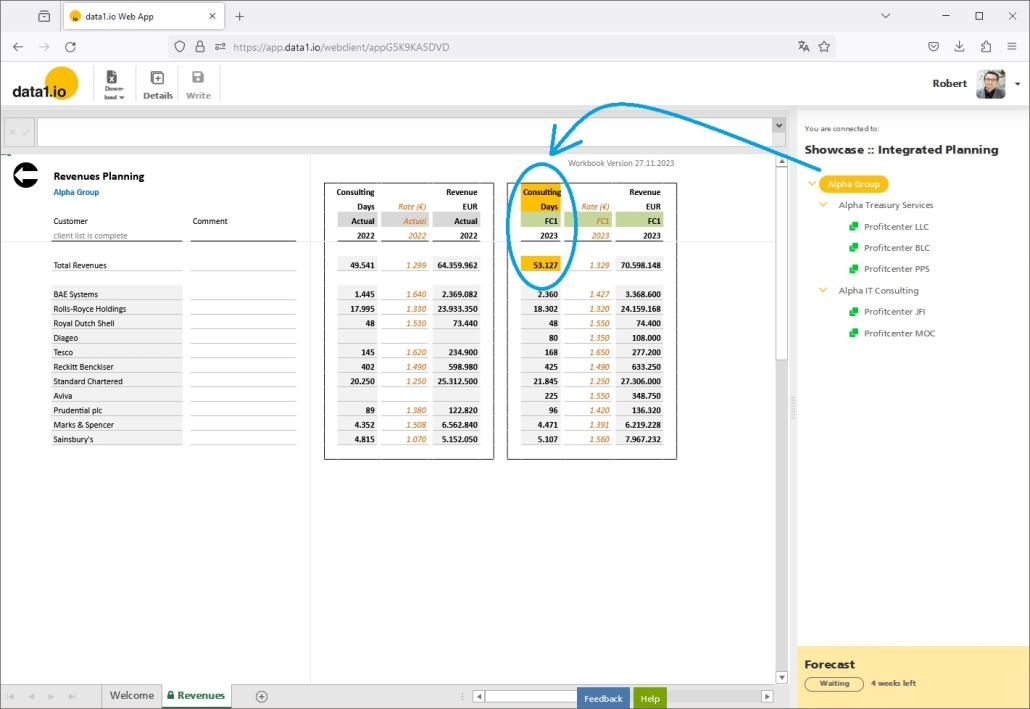
Let’s have a look on a practical example. We assume that the creator of this workbook has decided that there should be 2 data entry blocks behind each other – one for capacity metrics (left block) and another one for financial metrics (right block).

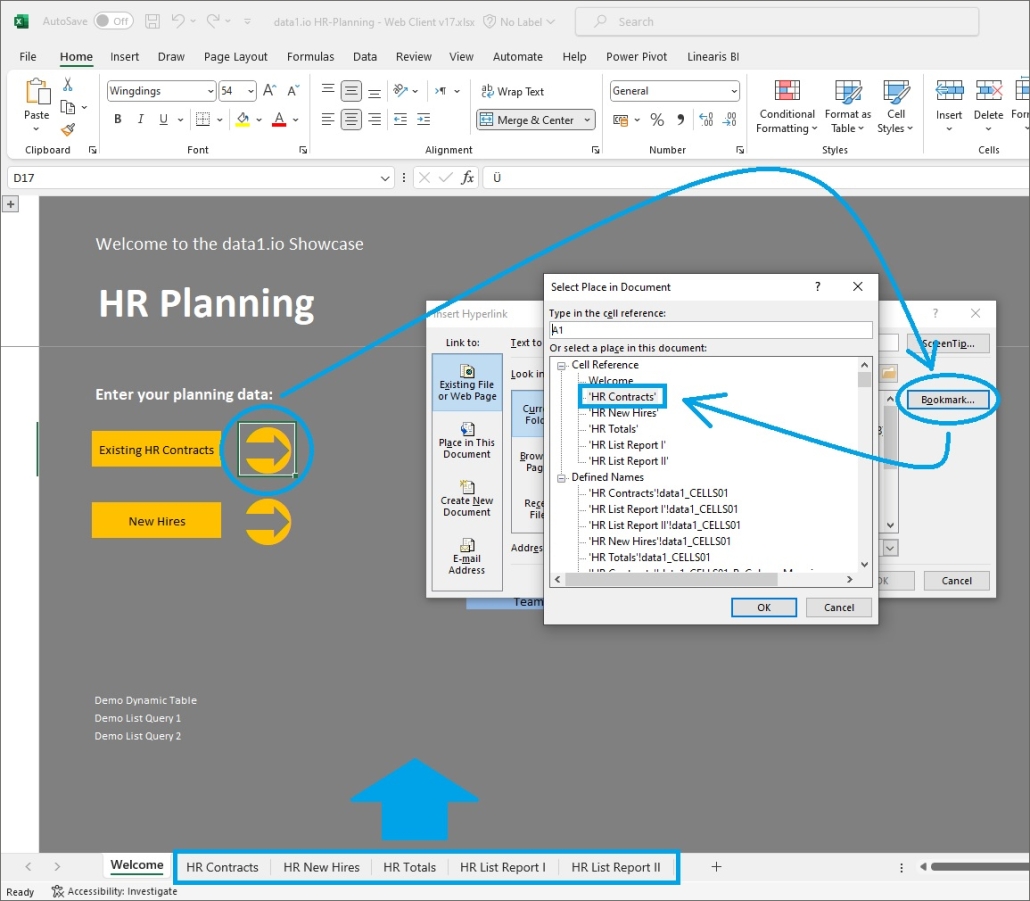
c. Example – Definitions
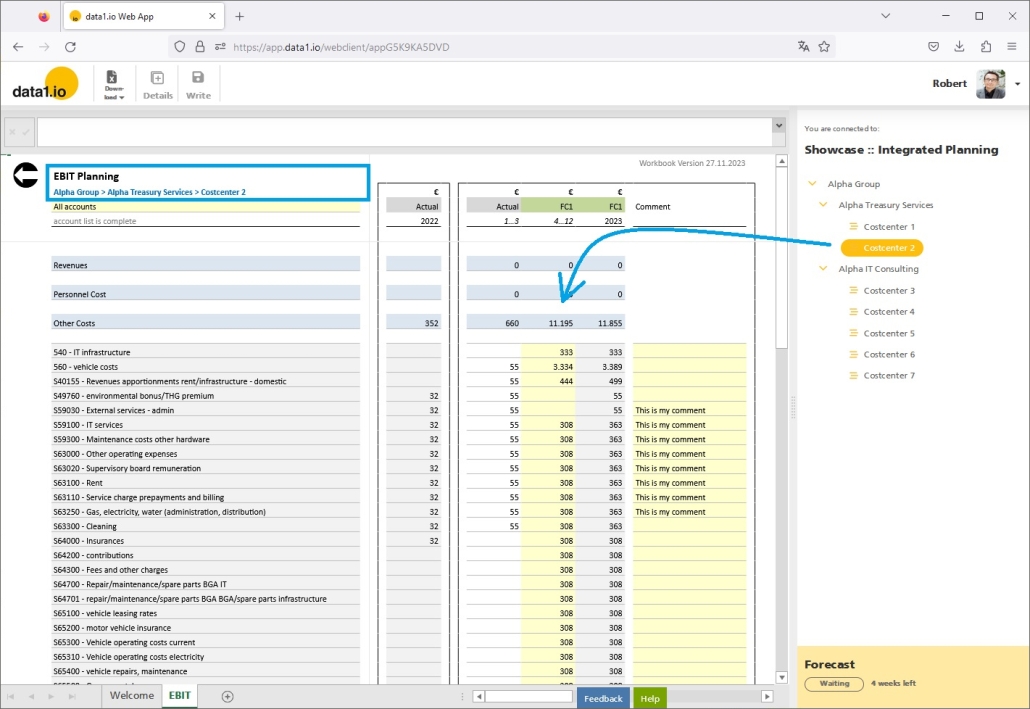
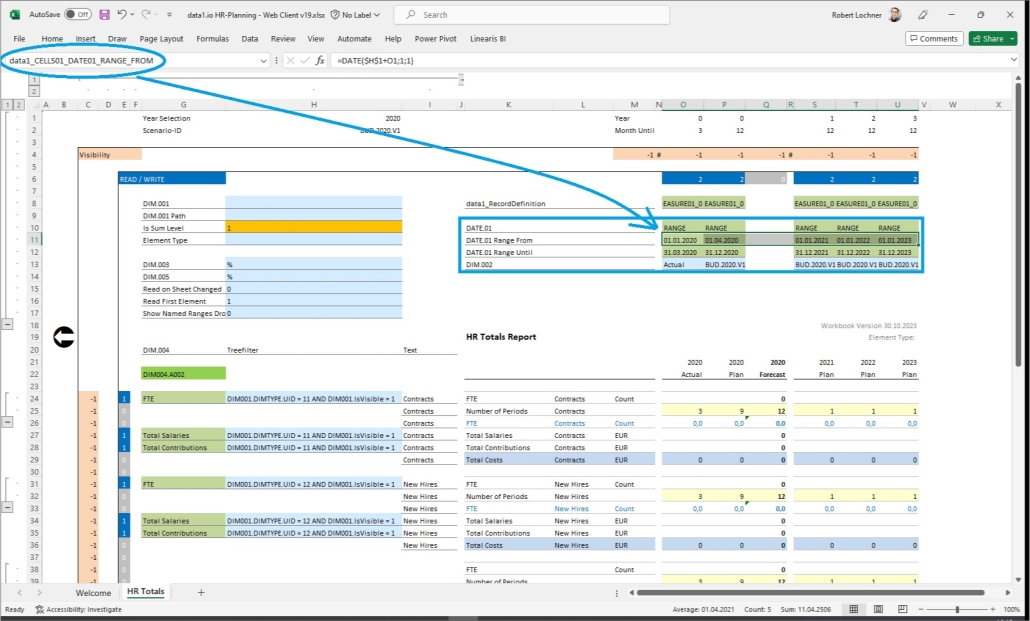
This type of layout would not have been possible until now since the named range for the metrics dimension could be done over 2 columns. With the new possibilities, a CELLS02 data entry area can be defined with its own independant DIM004 definition (which is used for the metrics in this application):

Following the data1.io Workbook Framework the full set of named ranges has to be defined for the new CELLS02 data entry area:

d. Example – Performance Analyzer
You can see the number of data entry areas – CELLS01, CELLS02, etc. – also in the Performance Analyzer:

As you can see, the second data entry area comes with a price on performance since the CELLS02 area generates its own SQL queries against the SQL database in the backend. So you should use this new functionality only, if there is an added value for the collector users.
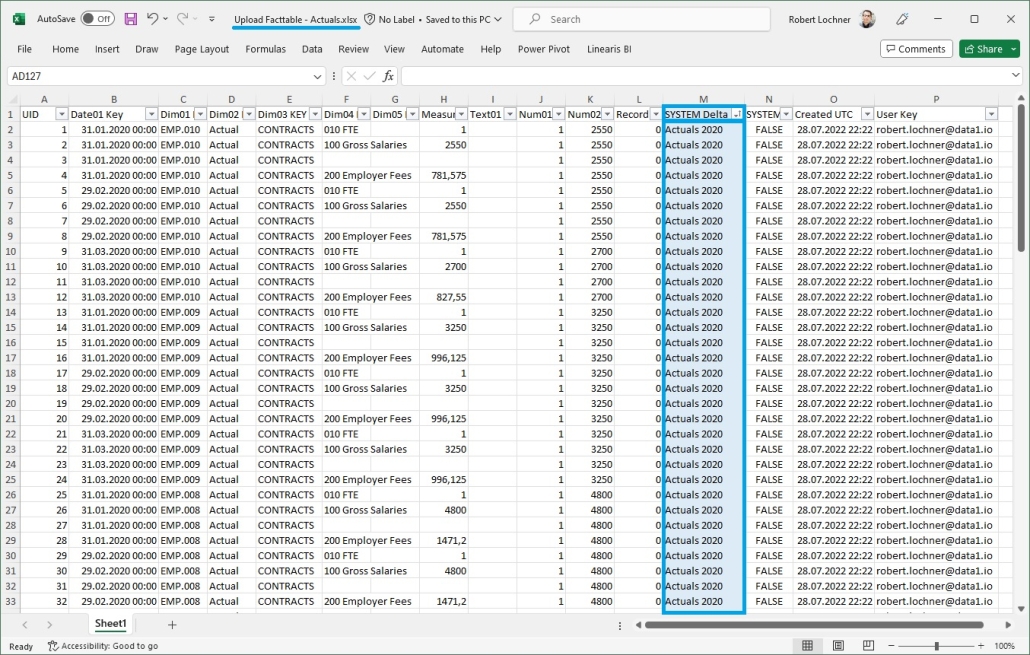
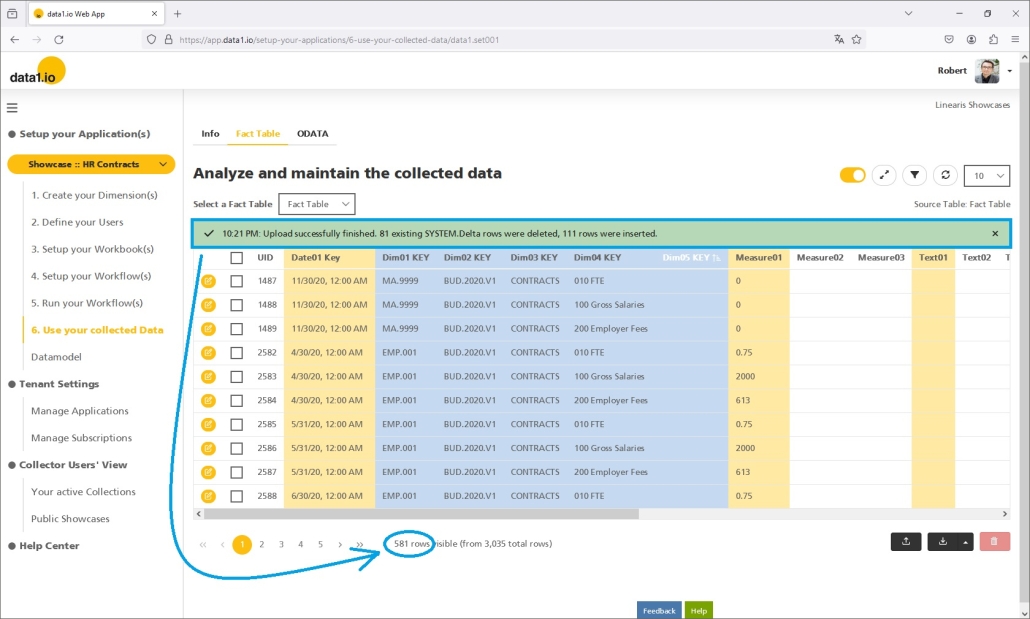
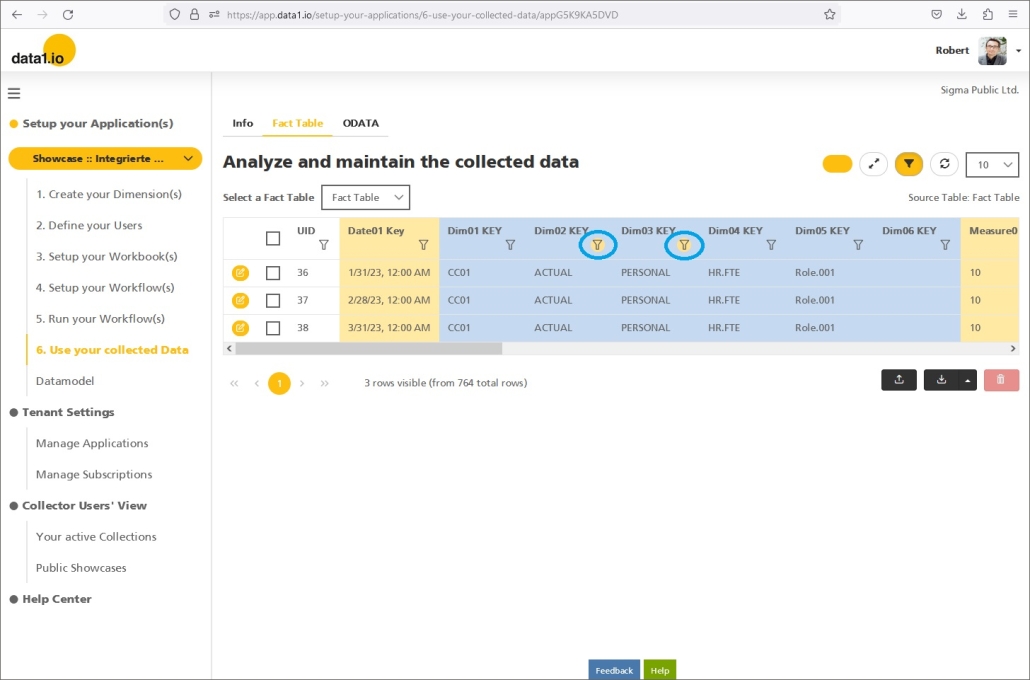
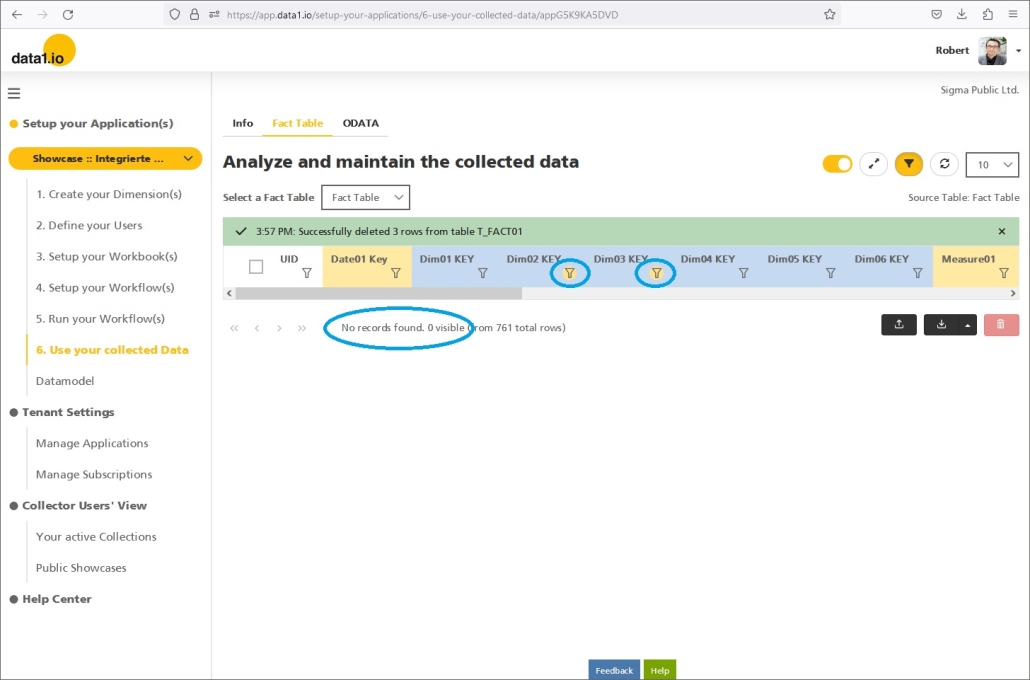
e. Example – Fact record structure
The structure of the fact records is NOT affected by the number of data entry areas (CELLS01, CELLS02, etc.). You can see the two data entry areas in this fact table only because the creator of the workbook has decided to differentiate the “Dim03 KEY” and the “SYSTEM Delta” parameters:

Therefore the creator of the workbook has to guarentee that the data from the several data entry areas are not mashed up in the fact table and therefore also get mashed up during the READ process. Therefore CELLS02 definitions are an advanced feature. Please contact us, if you need some help with your application.
(2) Web Client: Initial Refresh for Dynamic Tables
We have introduced dynamic tables in July 2021 (it was called then “Filter Tables”) and improved this feature in several releases of 2021 and 2022. We are happy that with this release we can deliver an important new function that will make this feature much more relevant in practice!
Usually dynamic tables are placed in hidden sheets of a workbook and they serve as a source for dropdown selections and so on. Until now, those hidden dynamic tables could only be loaded / refreshed with a READ-Sync from another visible sheet. The problem is, that with every READ process in the visible sheet also the hidden dynamic table has to be refreshed although the data in the table does not change. This comes with high cost for the READ performance in the visible sheet.
With this release you can define the new parameter
- data1_CELLS01_InsertTable_ReadOnLoad
whereby
- 1 = execute an initial READ on the dynamic table when loading the workbook even if the sheet is not activated or even if the sheet is hidden
- 0 = default behaviour … the dynamic table is refreshed only (a) if the sheet is activated or (b) if a READ-Sync is defined for this sheet

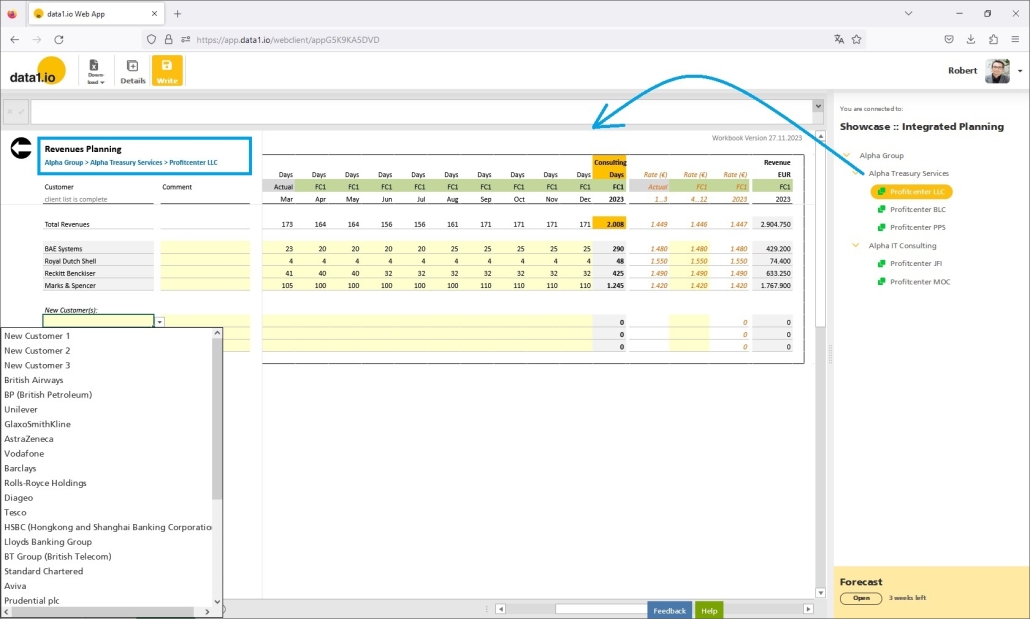
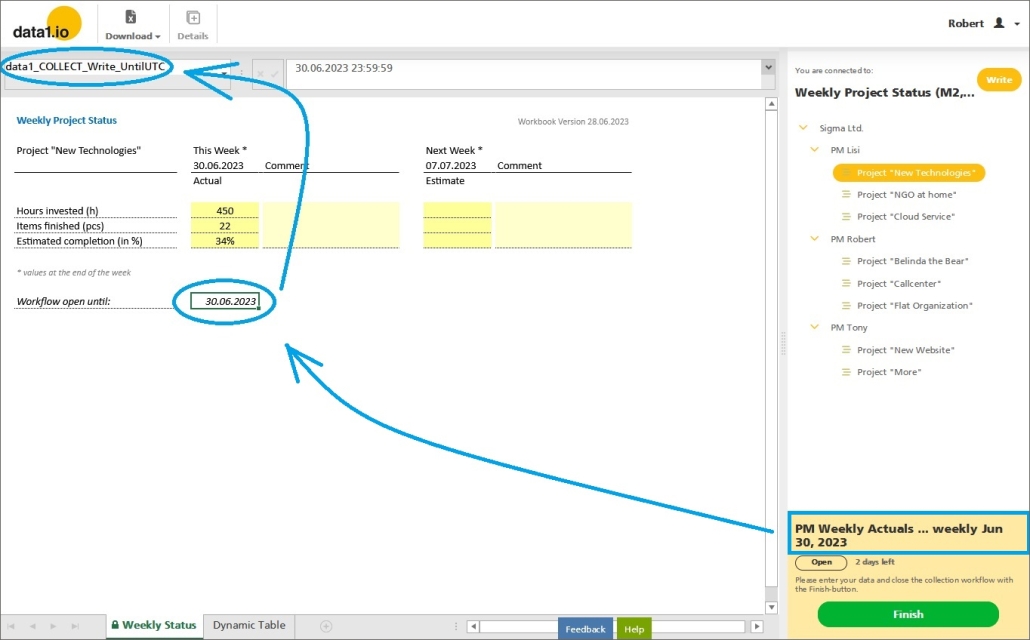
With this new parameter activated, the hidden dynamic table is refreshed already during the initial load process of the workbook. You can prove that with a metric using the COUNTA() function on the hidden table (which shows here “33” clients in the hidden table):

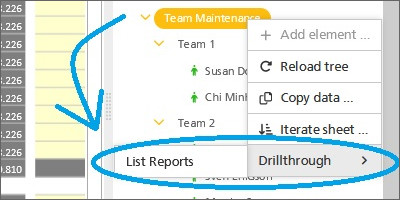
If there is a navigation button to the hidden sheet with the dynamic table, the current content of the table can be checked in every detail:

Please be aware, that the initial load does not change the behaviour of the sheet itself. If the sheet with the dynamic table is visible, then additionally to the initial refresh the dynamic table will also be refreshed when activating the sheet and it will also be refreshed with every element switch in the dimension tree.
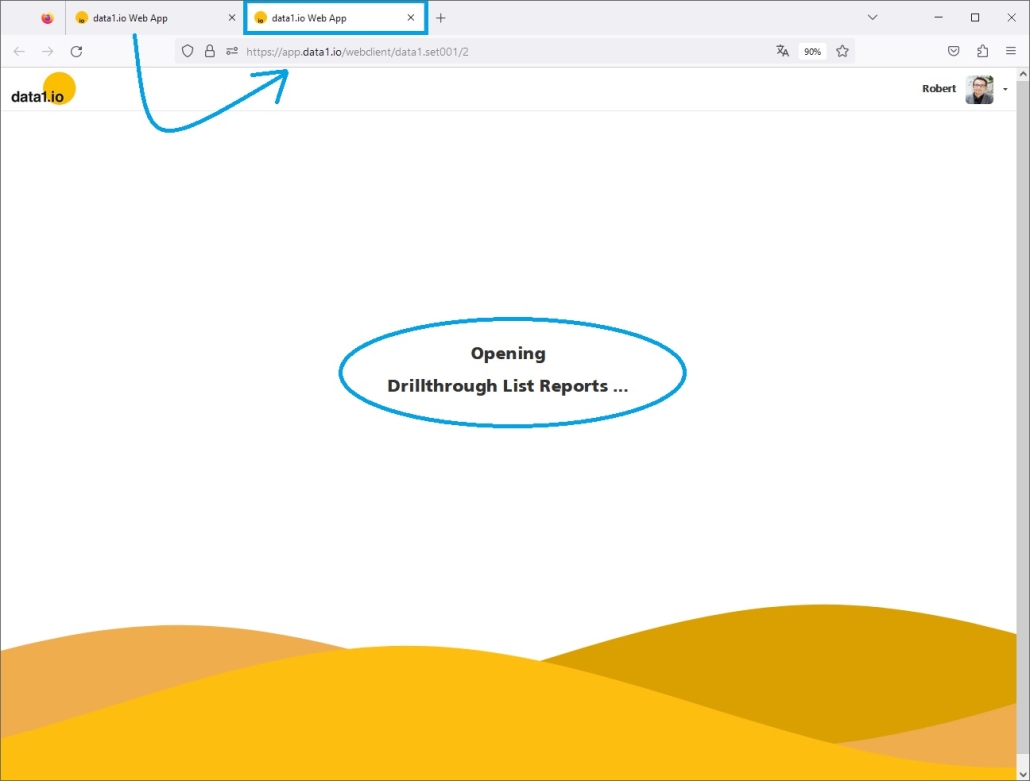
(3) Web Client: Improved Loading Screen
We have improved the Loading Screen for Workbooks respectively the Web Client. The loading screen now shows the single steps that are executed in the background. This way, you and your collector users are informed about the loading processes and the time that is necessary to do this.

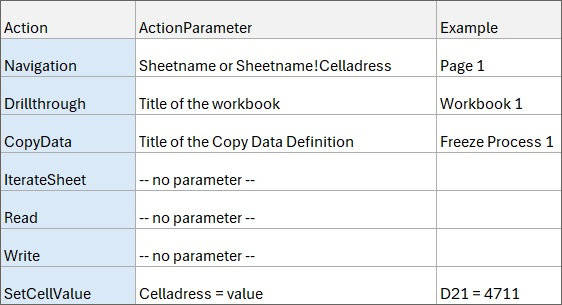
(4) Web Client: Action Buttons on Merged Cells (Preview)
We have introduced the new Action Buttons in March 2024 release as preview and improved them in April 2024 release. With this release we added the support for merged cells in the Excel spreadsheet. This way, it is easier to combine buttons of different size in the same column or rows.
Look at this button …

… it is defined in a merged cell area consisting of 4 cells:

Simply merge the cells in your Excel Workbook and then the Action Button will be generated in this cell area.
Please be aware that the new Action Buttons are still in preview.
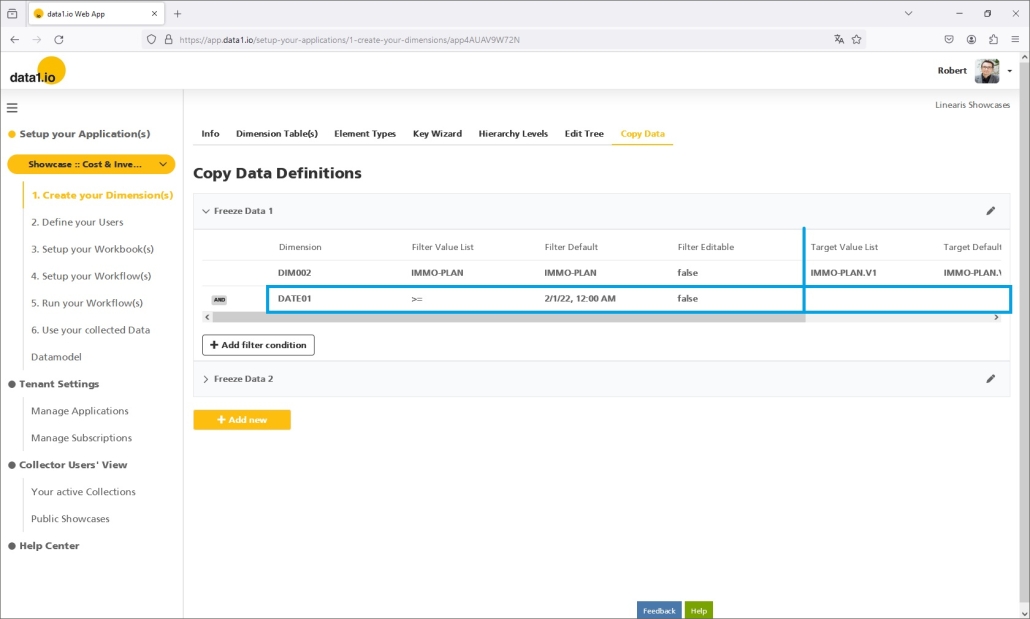
(5) Web App: Improved Date Format
Finally we have managed to display dates simply in their original format – as date!

Until now dates were displayed as date/time (“30.06.2024 12:00 AM”) which could lead to confusion about the real content of date columns. The new date format uses the english date format.
(6) Debugging and Improvements
We have improved the refresh of the dynamic tables – until now it could happen that after the refresh of the table old records remained outside of the table object somewhere in the spreadsheet.
Furthermore we have solved an issue with the record structure of the new SYSTEM Delta definition introduced with the April 2024 release.
We hope you like the new features – we are very curious about your feedback!
Please let us know what you think about data1.io and what kind of planning and data collection processes you evaluate to automate.
we #StandWithUkraine