Release December 2022

We are happy to deliver the brandnew December 2022 release with the new “Aggregate only visible elements” function and many other new features! Try it now!

Remember, the Web Client is the user friendly spreadsheet for your Collector Users to deliver their monthly/weekly/daily data. The Web App is the tool for the Power User to setup and control your organization’s collection workflows.

(1) Web Client: New option for “Aggregate only visible elements”

Until now, on a sum level all values from all elements below were aggregated. This can lead to unexpected and even incomprehensible aggregated values, if there are “dormant” values on records from hidden elements or values that were written to the wrong element type (for whatever reason).

The new option “Aggregate only visible elements” sums up values from subordinate elements with 2 conditions:

  1. The Treefilter (from the named range “data1_TreeFilter” on the sheet)
  2. The element attribute “Is Visible = True” (from the dimension table / tree)

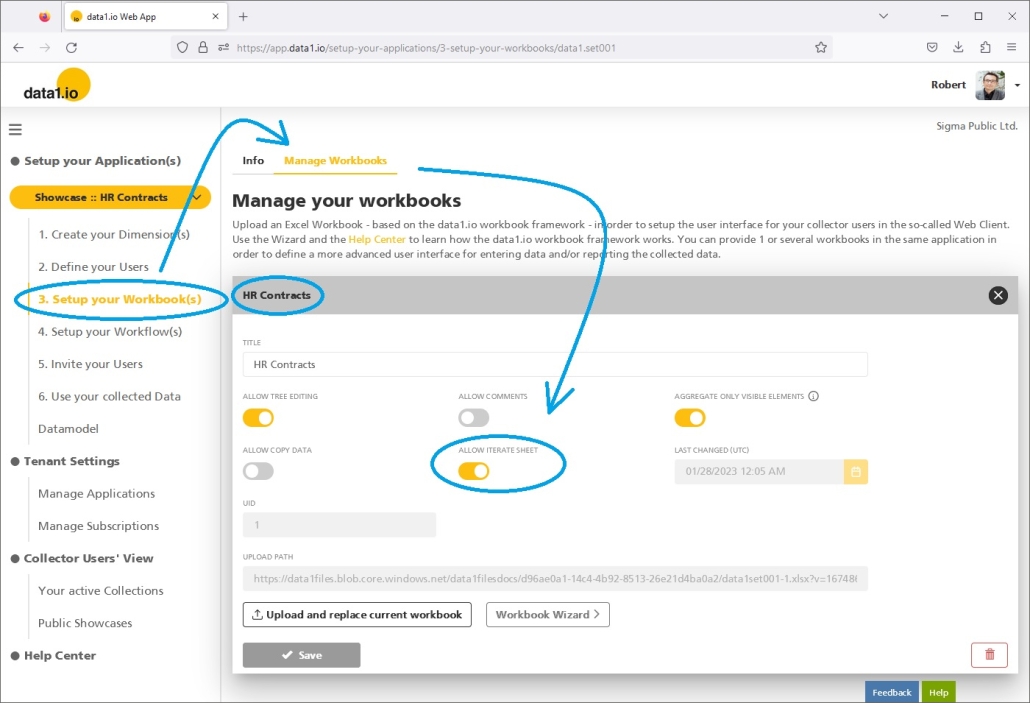
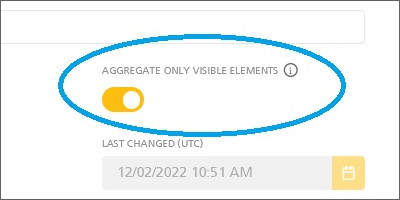
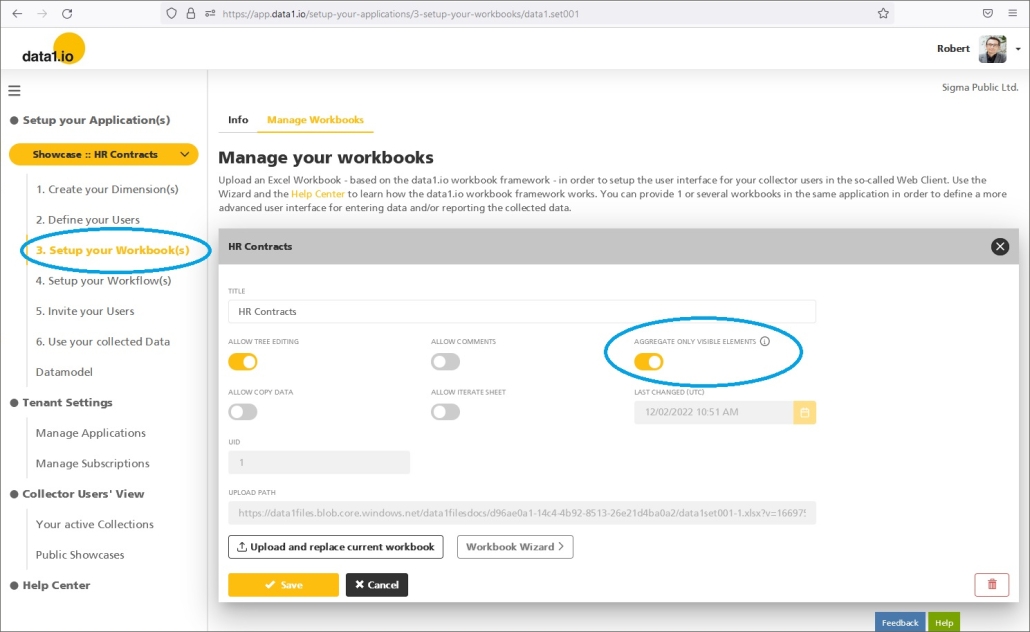
The option is activated via a new setting on the workbook:

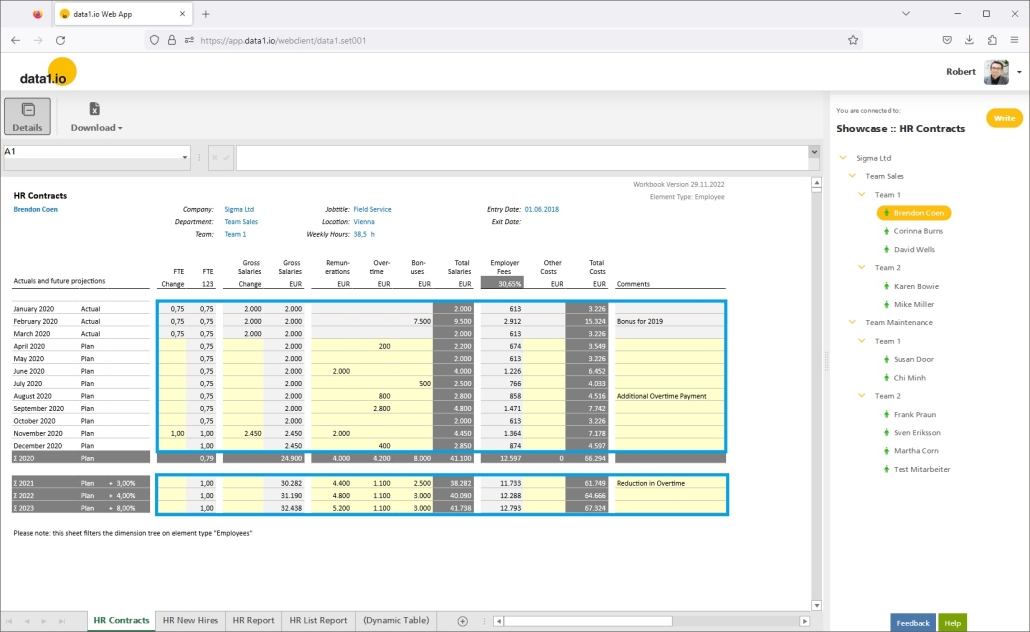
With the option activated you can be sure that the values on an aggregated level are by guarantee the sum of the visible elements below that node:

(2) Web Client: New option for “Allow Comments”

The “Add Comment” function in the workbook is not in all cases a useful or desired feature:

For this reason we introduce a new setting – also on the workbook level – to activate or deactivate the comments function in the workbook:

(3) Web Client: Sheet changes now with “You have unsaved data” message

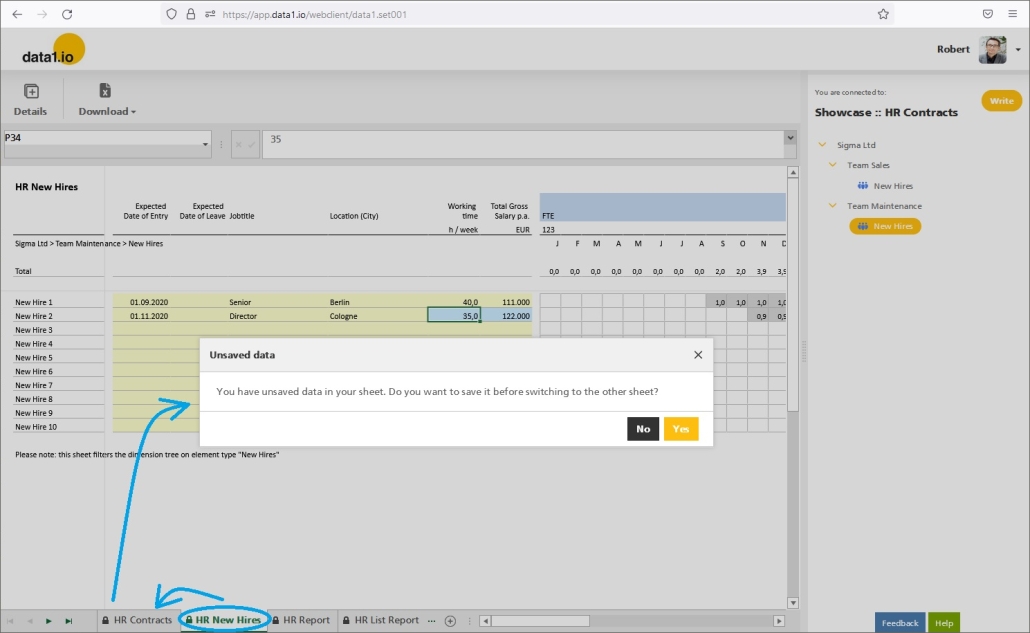
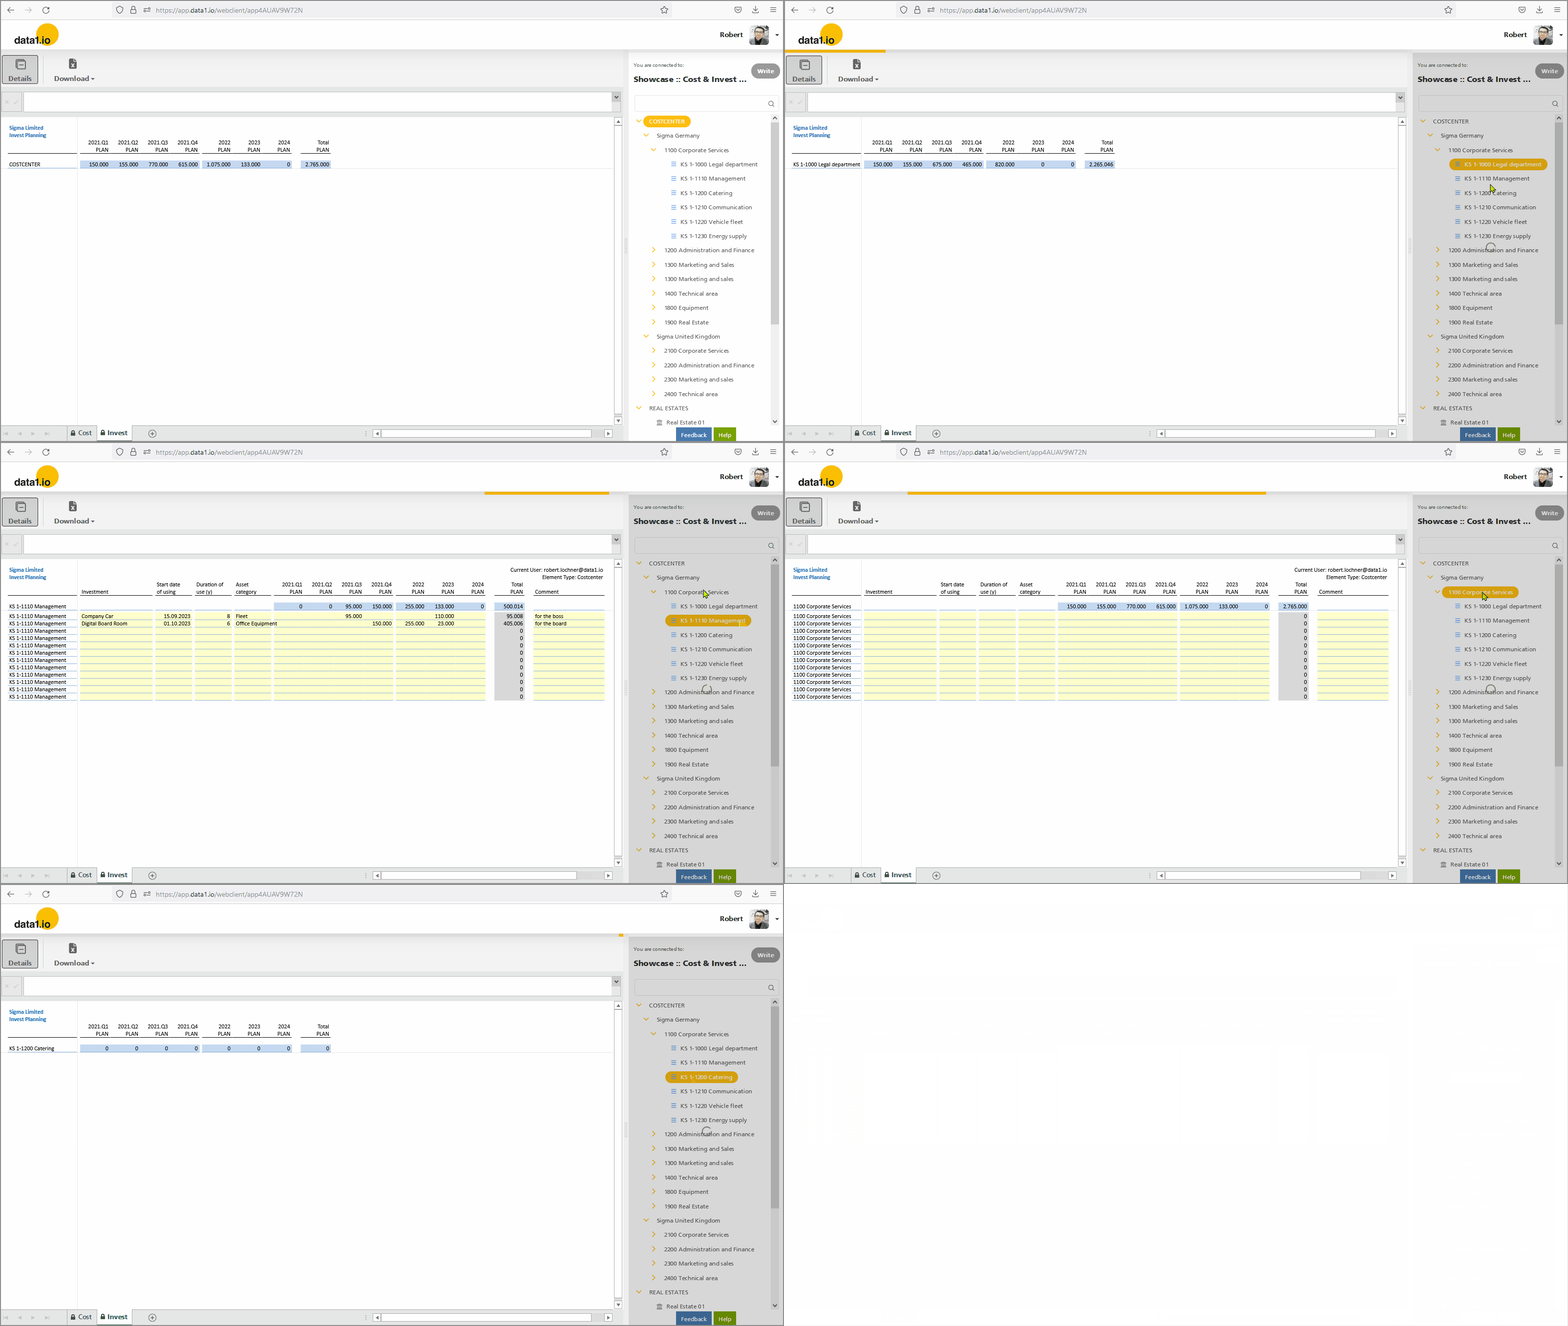
A small but important new feature for all multi-sheet applications is the “You have unsaved data” message which is triggered now not only by changing the active element in the dimension tree but also on changing the sheet if you have unsaved data:

This new behaviour makes it more realistic NOT to sync especially the READ process over several sheets of the workbook. That in turn can save a lot of performance in such multi-sheet applications.

(4) Web Client: Display of long tree element names

Until now, long element names in the dimension tree were wrapped over several rows. This looked a little bit messy, now we changed that behaviour that way that each element is shown in one row independently from the text length:

(5) Web App: New table filter “Is Empty”

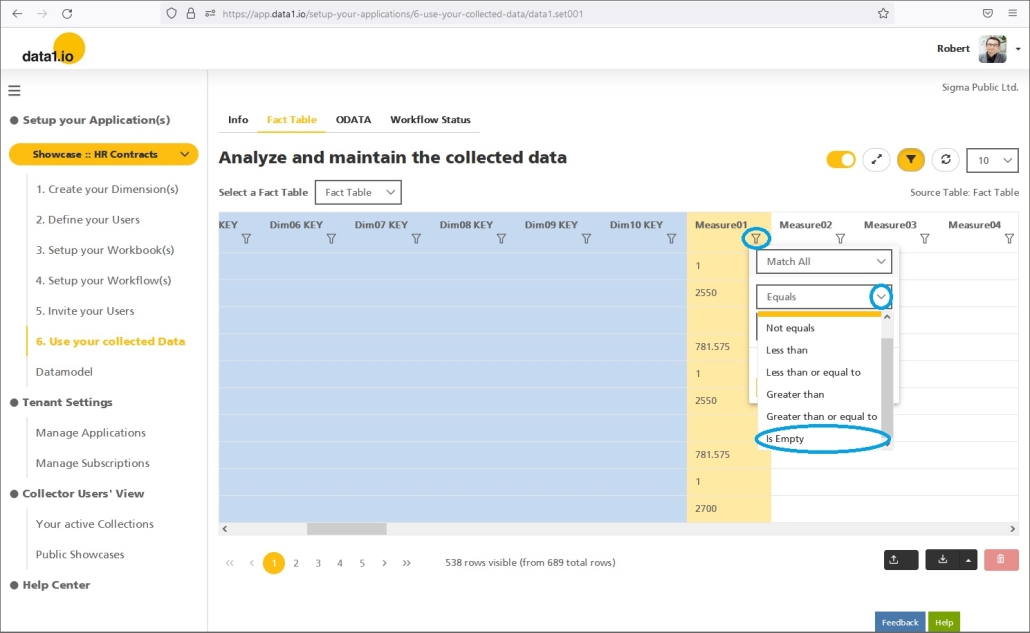
We have added the new “Is Empty” option in all table filters which makes it much easier now to e.g. delete such records from a table in the backend of your application:

(6) Web App: Table filter with several conditions

There was an issue when you combined several filters on the same table with the “Match Any” option. This is solved now so that you can combine any filters on the same table:

(7) Web App: New retry logic

In the cloud service, we have implemented a new “retry logic”. This helps to handle connection errors, timeouts etc. and makes the Web Client as well as the Web App more stable.

(8) Install data1.io as Browser App

It is possible now to install the data1.io service as a Browser App. Browser apps are supportd in Chrome and Edge but not in Firefox at this time.

Simply click the “Installation” option in the menu of the browser …

… and then install it:

Now you can use the data1.io service like an app on your desktop: you can simply pin it to your Windows Taskbar and start the Web Client or the Web App this way.

(9) Technical Improvements and debugging

There was an issue with the dropdown list for the definition of the element type in the dimension table.

Another issue was solved with cell comments which were not shown correctly in multi-sheet applications.

Then an issue with the READ process in a vertical “data1_CELLS01_ByColumnMapping” scenario had to solved as well as an issue with the ExceptionType2.


Hope you like the new features – we are very curious about your feedback!

Please let us know what you think and what kind of collection processes you would prefer to automate with data1.io. 

Stay healthy and we #StandWithUkraine

Release November 2022

We are happy to deliver the brandnew November 2022 release with the new Details Button and Tree Attributes functions and many other new features! Try it now!

Remember, the Web Client is the user friendly spreadsheet for your Collector Users to deliver their monthly/weekly/daily data. The Web App is the tool for the Power User to setup and control your organization’s collection workflows.

(1) Web Client: Extension for the details function

In the September 2022 Release we have introduced the new Details function. Now we have extended the function with the new parameter “2“:

  • 0 = always hide the column or row
  • 1 = hide/unhide the column or row with the details button
  • 2 = always show the column or row
  • any other = do nothing

Furthermore we have added a “change trigger“: whenever a value changes in the visibility named ranges, then the details function is executed and the rows and columns are hidden or shown immediately (depending on their current definition).

You can use this for many fields of applications, get inspired by the following two.

Fields of application #1: showing detail rows controlled by dropdown selections

You can control now the visibility of rows and columns simply with dropdowns – and of course you can combine this also with the Details button:

In the background this is simply done by connecting the visibility settings with the dropdowns via normal Excel formulas:

Fields of application #2: showing/hiding details rows/columns controlled by the element selected

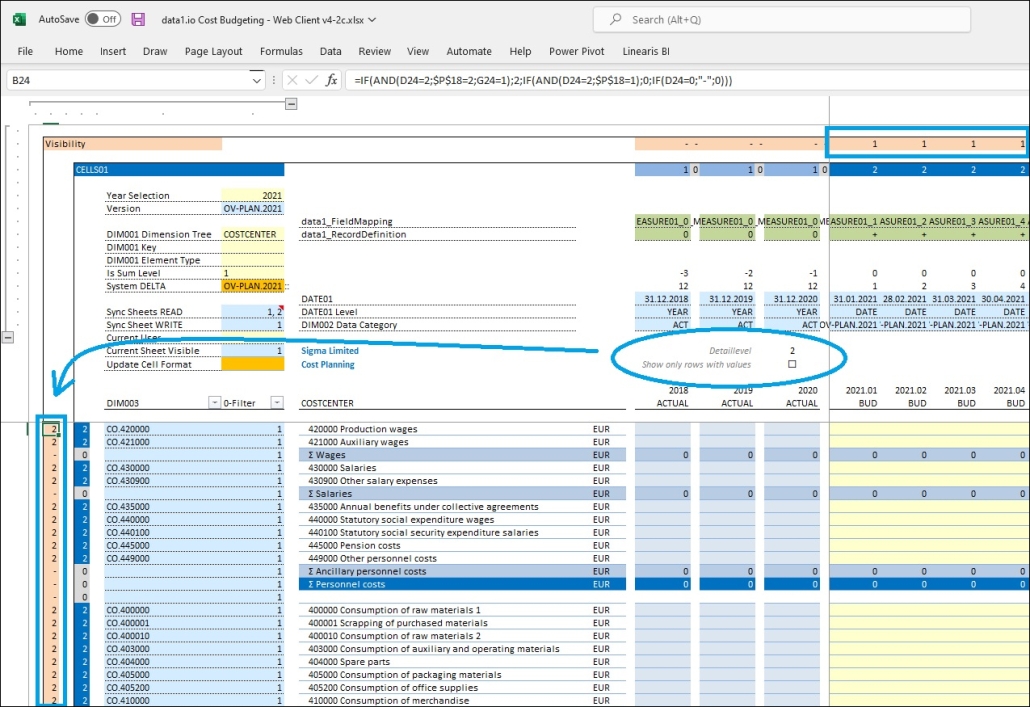
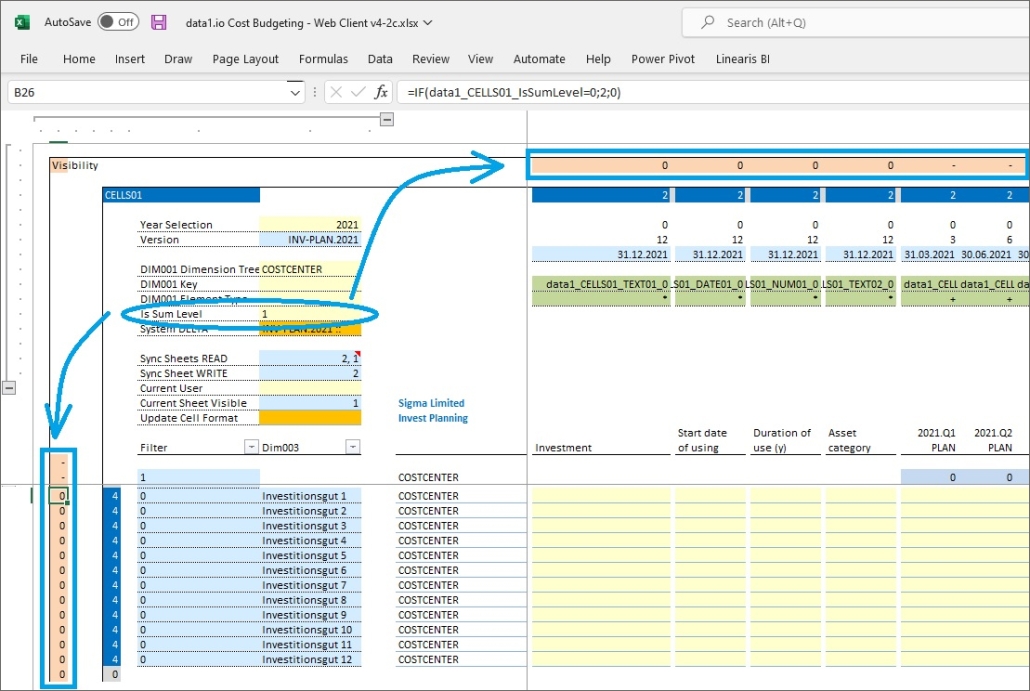
You can show/hide now very easily rows and columns that are only relevant on the bottom level of the dimension tree:

In the background this is simply done by connecting the visibility settings with the value of the data1_CELLS01_IsSumLevel parameter:

Please be aware that this feature causes a performance overhead – therefore test your workbook carefully with this great feature before you publish it to all your collector users.

(2) Web Client: Force update popup

This is a very important new feature!

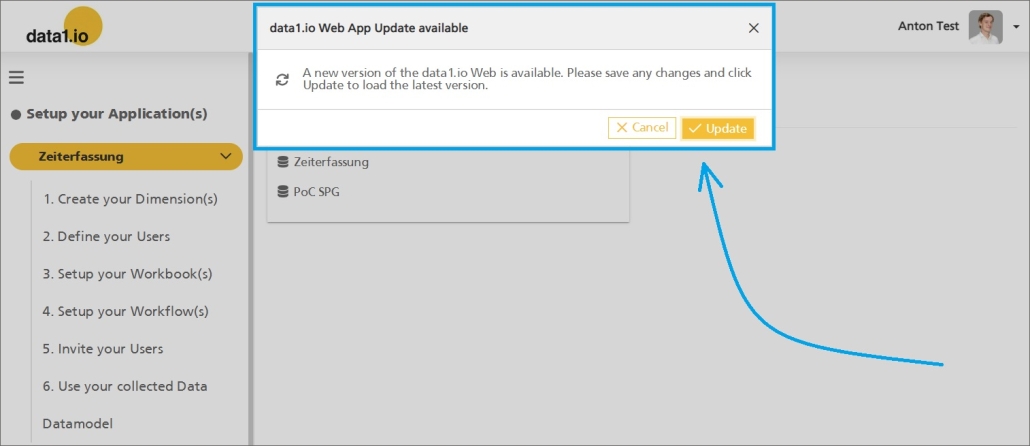
Since many (collector) users keep their browser tabs open for several days (or sometimes weeks), this can be a big problem since they would not work with the current version of the data1.io Web Client / Web App. This is solved now since every user gets an update message box when the version is not the newest one:

(3) Web Client: Column selection for dynamic tables

The column selection for dynamic tables can now be configured: simply define (or leave) only those column of the table that are relevant for your usecase.

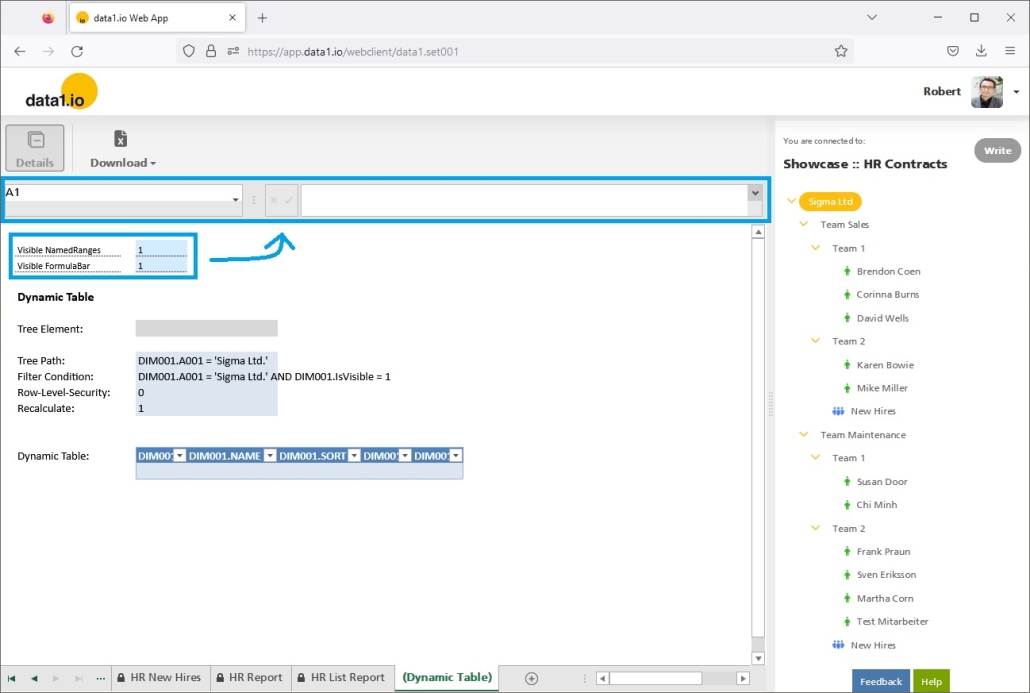
(4) Web Client: Show/hide the named ranges dropdown and the formula bar

The named ranges dropdown can be a security risk since your collector users could enter settings that maybe are not protected and could then be edited.

With this release you`ll find two new parameters:

  • data1_Visible_FormulaBar
    0 = hide
    1 = show
    no definiton = default = show
  • data1_Visible_NamedRanges
    0 = hide
    1 = show
    no definiton = default = hide

Setting the value to “1” will show both the named range dropdown as well as the formula bar:

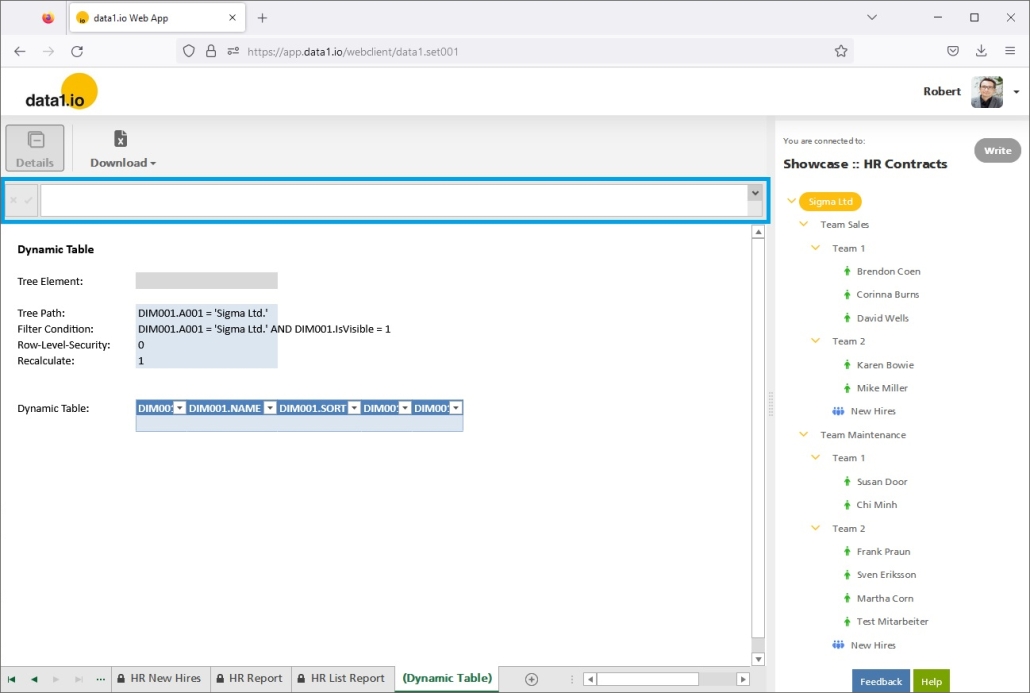
Setting the value to “0” will hide both:

No definiton will show the defaults – formula bar on and named ranges dropdown off:

(5) Web Client: New parameter to trigger the row filter

There is a new parameter

  • data1_Trigger_RecalculateAndApplyFilterOnChange

With this named range you can define one or more cells of the sheet as trigger cells to execute a RECALCULATE of the formulas on the sheet and a refresh of the ROW FILTER (“auto filter”). The second feature is similar to the automatic “change trigger” for the new visibility settings presented further above in item #1.

(6) Web Client: Improvements on the reload of the dimension tree

We have solved an issue with the reload of the dimension tree after editing e.g. the element type of an element.

(7) Web Client: Improvements on sheet changes

We have solved issues with the parameter data1_ReadOnSheetChanged, which was introduced in the June 2022 Release. This worked already well with the parameter “1” (= READ when re-entering the sheet) but not with the parameter “0” (= no READ when re-entering the sheet). In this case, the dimension tree was not shown correctly when coming back to the sheet. With this release we have solved this and it works now well with both configurations.

We have solved also an issue with the parameter data1_CELLS01_SyncSheets_Read, which triggers the READ process over several sheets. It happened that the Write button was not activated when re-entering the sheet although it should have been. This is solved now.

We have solved a third issue with same name sum-level elements in the dimension tree. It happened that the wrong sum level element with the same name as the selected element was READ when re-entering the sheet.

(8) Web Client: Improvements on the “Download every tree node” function

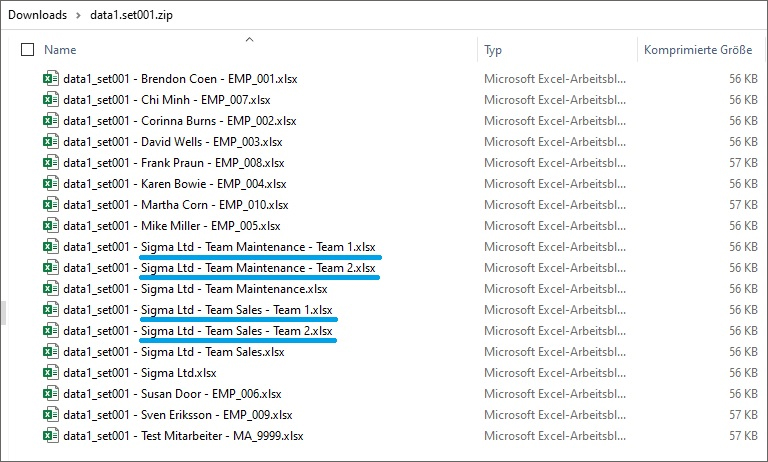
We have solved a bug with the “Download every tree element separately” and same name elements:

The download files of the sum-levels are now named with the full path of the node – there same name elements do not overwrite each other any more:

(9) Web App: Improvements on deleting records from (large) tables

We made the process of truncating a table (= deleting all records of a table) now also to background task although this would be not necessary from a technical point of view. But this guarantees the same user interface for all types of deleting records from a table.

(10) Technical improvements and debugging

We have solved two bugs with the conditional formatting feature in the Web Client`s spreadsheet. One confused the “. and ,” due to language settings and another one overruled the “cell locked” property and opened locked cells for data entry. Both issues are solved now.

Another issue happened in the “Weekly Projects Showcase” (which uses the so-called “BY-CELL” mode): the writeback of only empty cells was not executed. Now it is exectued.


Hope you like the new features – we are very curious about your feedback! Please let us know what you think and what kind of collection processes you would prefer to automate with data1.io. 

Stay healthy and we #StandWithUkraine
Release October 2022

We are happy to deliver the brandnew October 2022 release with the new dimension tree setting in multi-sheet workbooks and many other new features! Try it now!

Remember, the Web Client is the user friendly spreadsheet for your Collector Users to deliver their monthly/weekly/daily data. The Web App is the tool for the Power User to setup and control your organization’s collection workflows.

(1) Web Client: Remember the tree in multi-sheet workbooks

Until now, in multi-sheet workbooks the dimension tree was always reset to its initial configuration when the sheet was changed.

With this release, every sheet stores now its individual tree configuration when the sheet is left:

In this sheet the tree configuration is different and also stored individually with this sheet when it is left:

See the new default behaviour in action:

(2) Web Client: Performance improvements for new Details function

In the last Release (September 2022) we launched the new Details function to hide / show rows and colunns by pressing the new Details button. We have learned that this feature is slow if there are a lot of rows and columns and if the steering parameter is calculated with formulas.

Therefore we have improved the feature by stopping the formula calculation during the show / hide process and then trigger a recalculate() after the process. This improves performance e.g. from 10 sec to 3 sec.

(3) Web Client: Performance improvements with Always Encrypted

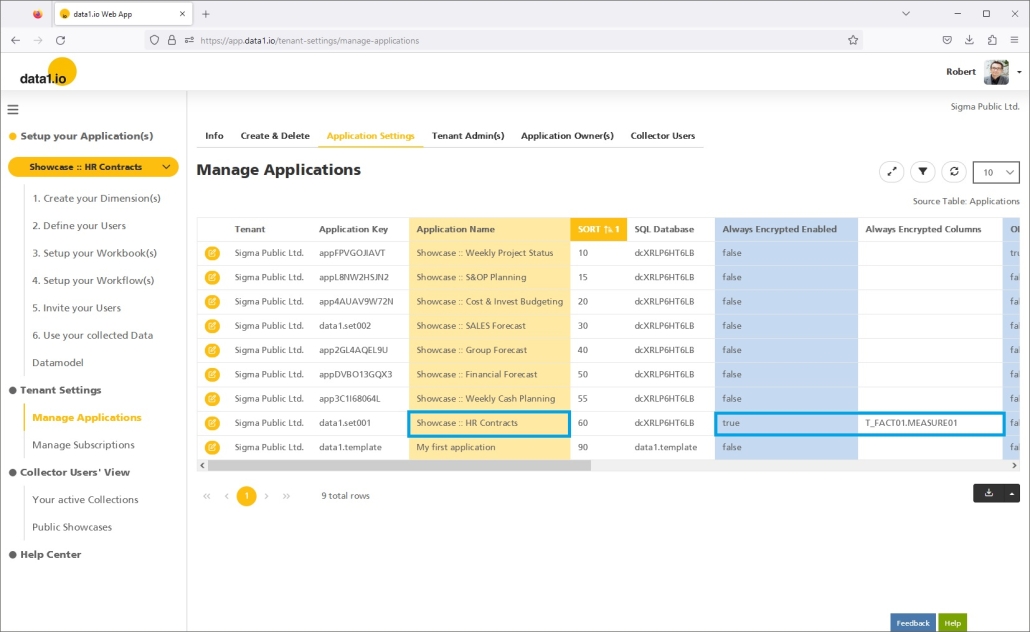
Always Encrypted means that the content of some or all columns in a database table of a data1.io datamodel is encrypted. That means that the content of this column is not readable for an unauthorized person even if this person should get access to the database. In the data1.io Enterprise Plan datamodels we usally encrypt the measure columns.

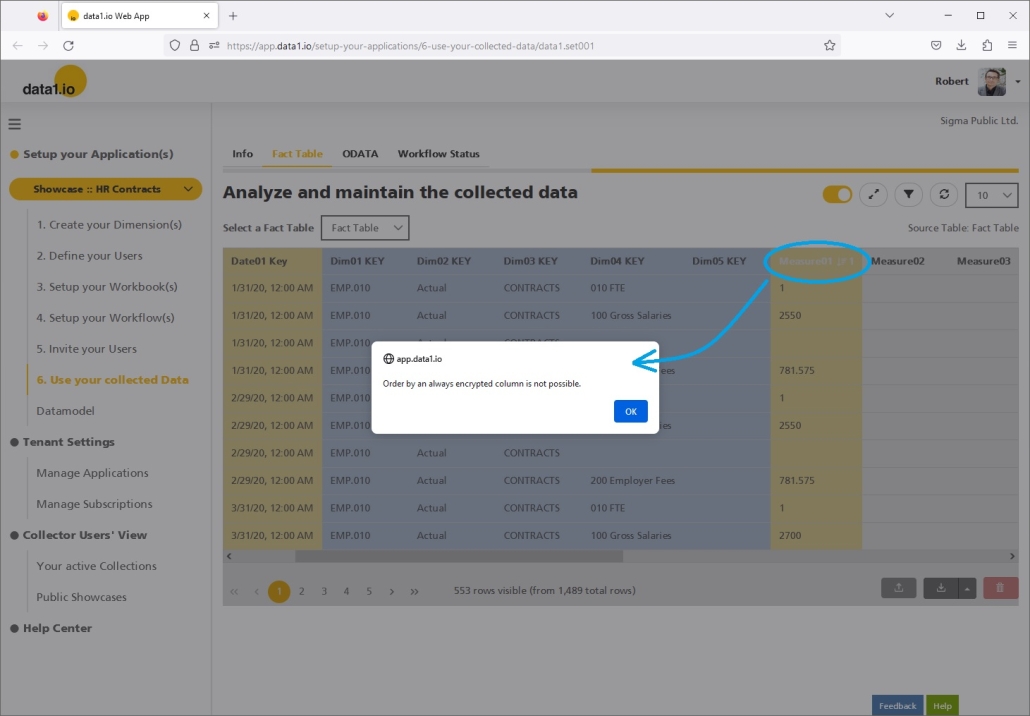
There was a big performance issue with this Always Encrypted feature (= Enterprise Plan). The issue was that a top level aggregation with e.g. 300,000 fact records takes 4 sec, with Always Encrypted enabled the same aggregation took 100 sec. We managed to improve this READ performance to about 10-15 sec which is a big step forward. Of course we will work to further improve that performance.

(4) Web Client: Changes on READ with the empty string “”

From now on, empty strings (“”) are not taken into account in the READ process. This is e.g. important if comments for Actuals should be collected with data1.io and the Actuals that were imported have empty strings in the relevant text attribute of the imported records. In this case it happened that not the entered comment (from the comment record) but the empty string (from the imported record) was shown on the READ process.

(5) Web Client: Changes on WRITE with the 0 and the empty string “”

From now on, 0 in measure cells are written back to the fact table as a record. This is important especially for the new forward projection feature which we introduced in the July 2022 Release. The writeback of 0 enables now the reduction of an existing projection down to 0 (until now you had to enter something like 0,001 to bring the value down to nearly 0).

On the other hand, empty strings (“”) in measure cells are not written back since this would cause a data type error on the numeric fields of the fact table.

This can be an important change for your application: if you don`t want that a result is written back you have no to output an empty string instead of a 0.

(6) Web Client: New multi-level query

Until now, a mix of different levels in a level query did not work – only the values for the keys were delivered:

With this release you can mix the levels as you like:

Please note that this is only a technical demo (the values and sums do not make sense).

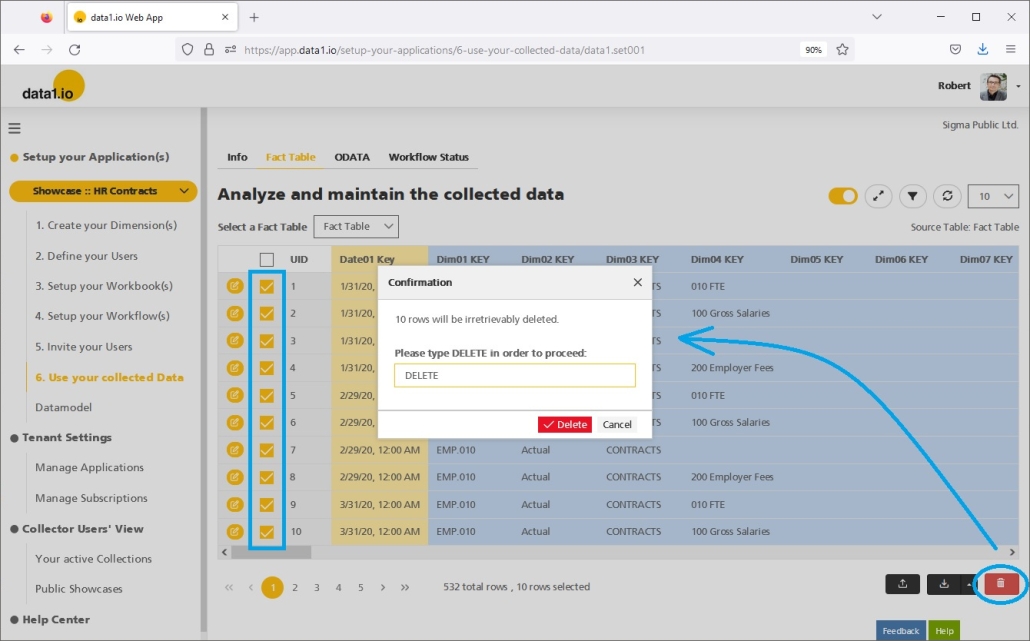
(7) Web App: Delete as background task

We have introduced the background tasks for uploads last month in the September 2022 release. This month we roll out the background task also to the deletion of records:

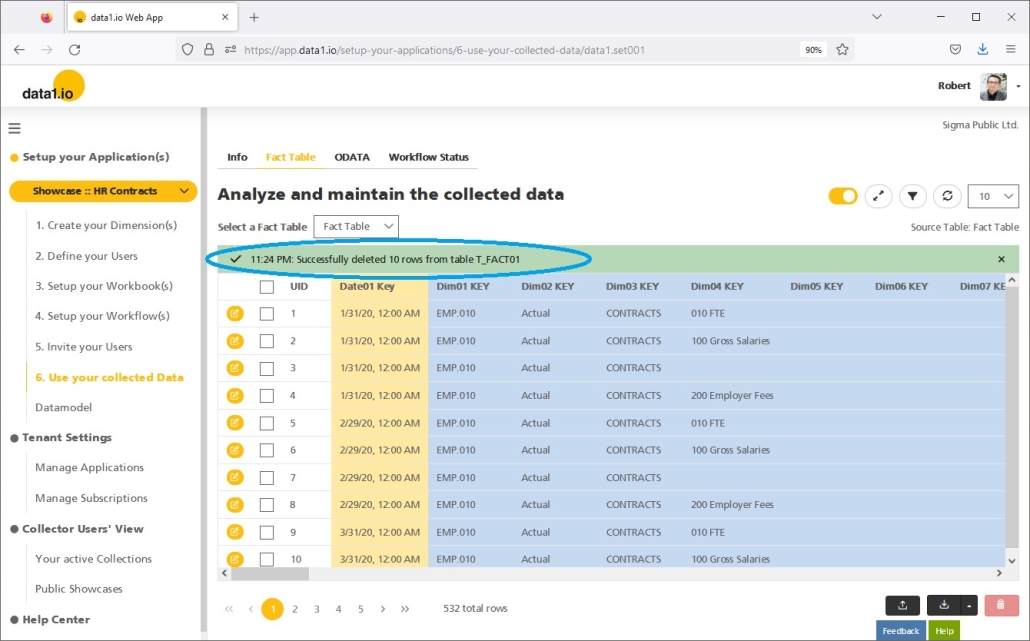
The deletion is executed as background task on the server, the status bar is shown during the process is running and after it is finished:

This new background task guarentees that the deletion works reliable also with a large amount of data.

(8) Technical Improvements and debugging

We have solved an important issue with the new parameter data1_ReadOnSheetChanged on writeback. Another 2 issues with comments were solved, the comments were not shown properly under certain circumstances. Issues in the workbook wizard and a wrong interpretation of percentage figures in the sheet are solved now as well. Furthermore we solved an issue in multi-workbook / multi-workflow environments.


Hope you like the new features – we are very curious about your feedback! Please let us know what you think and what kind of collection processes you would prefer to automate with data1.io. 

Stay healthy and we #StandWithUkraine
Release September 2022

We are happy to deliver the brandnew September 2022 release with the new Details Button and Tree Attributes functions and many other new features! Try it now!

Remember, the Web Client is the user friendly spreadsheet for your Collector Users to deliver their monthly/weekly/daily data. The Web App is the tool for the Power User to setup and control your organization’s collection workflows.

(1) Web Client: New Details Function to Show/Hide Columns and Rows

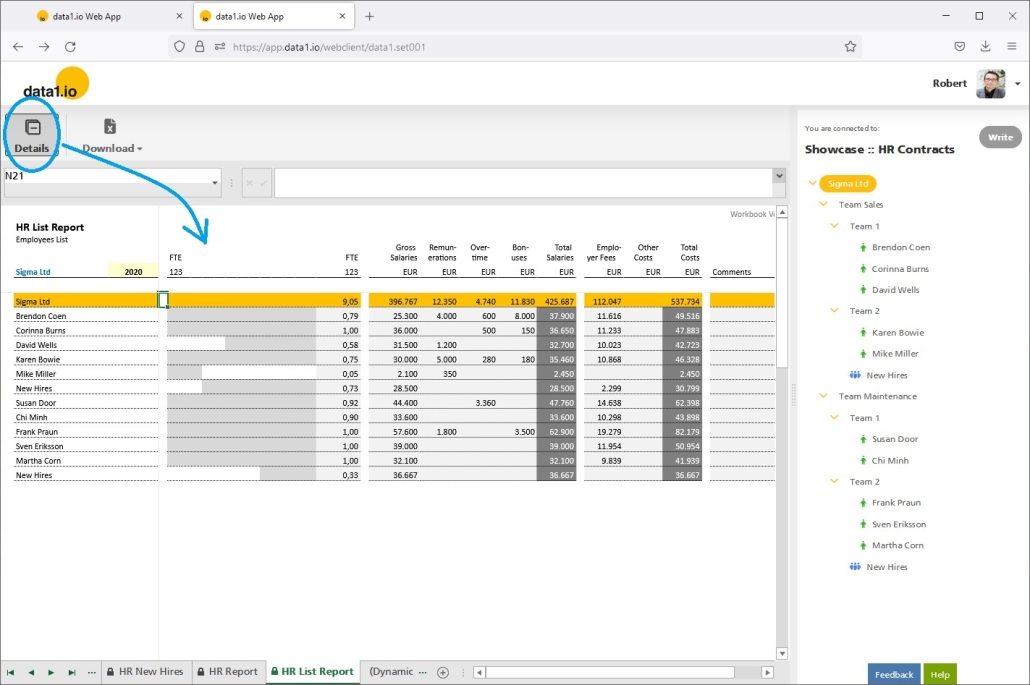
We are happy that we can deliver a new function to show/hide columns and rows. You will find the new button Details in the menu bar, this button shows hidden columns and/or rows:

Pressing the Details button again will hide the columns again:

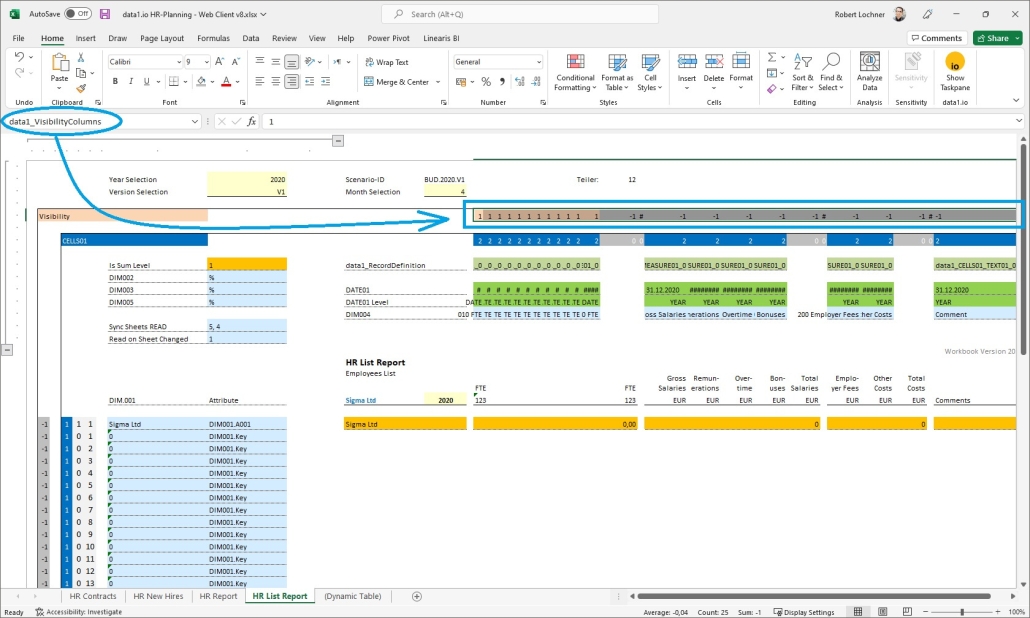
The Details button is always visible, but it will become active only if the sheet in your workbook has at least one of the following named ranges defined:

  • data1_VisibilityColumns
  • data1_VisibilityRows

Use the following codes in the cells of the named range:

  • 1 = hide/unhide the details column or details row
  • 0 = always hide the column or row
  • any other = do nothing

Tipp: use formulas in the cells of the named range in order get dynamically configured details.

(2) Web Client: New Named Ranges for Attributes

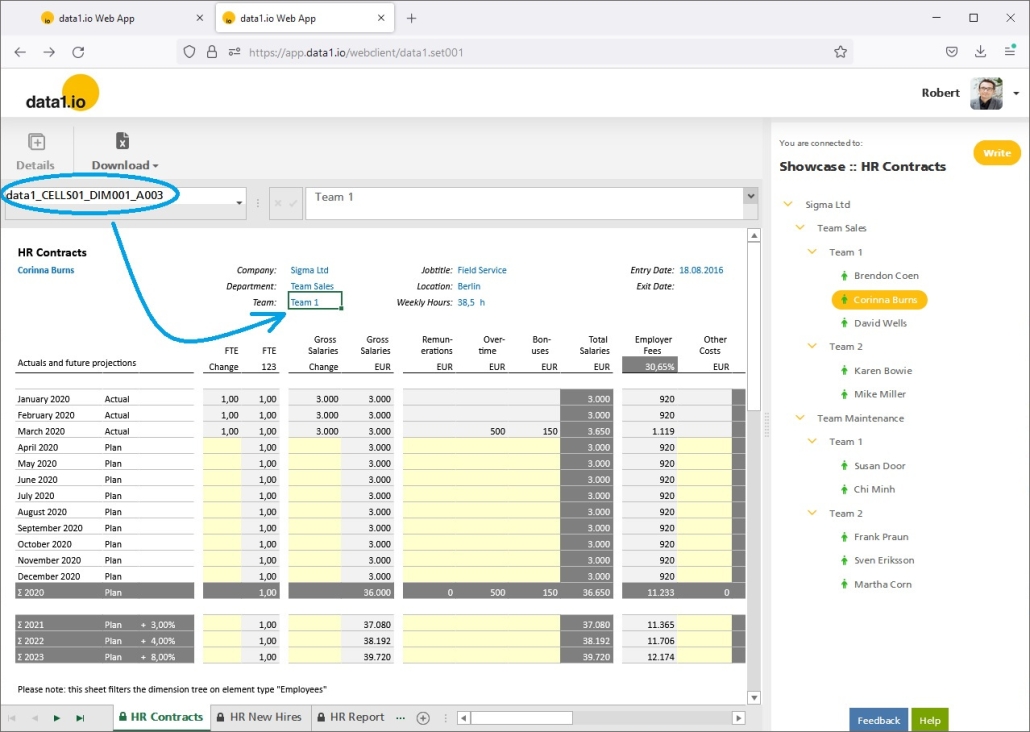
We are also really happy that we can deliver now a new and very effective way to show the value of an attribute from the selected element in the dimension tree. Just use the named range for the attribute you want to show in your spreadsheet:

  • data1_CELLS01_DIM001_A001
  • data1_CELLS01_DIM001_A002
  • ….
  • data1_CELLS01_DIM001_D001
  • data1_CELLS01_DIM001_D002
  • data1_CELLS01_DIM001_N001
  • data1_CELLS01_DIM001_N002

So the new named ranges show the content of the underlying Dimension Table:

Those attributes queries work also on sum level: if there is only one distinct element in the query, then this element is shown. If it would bring multiple values then nothing is shown.

(3) Web Client: New Breadcrumb Display

We have created a new named range “Path” in order to create a breadcrumb display of the currently selected item in your workbook.

Use the following two named ranges:

  • data1_CELLS01_DIM001_Path (new)
  • data1_CELLS01_DIM001 (existing)

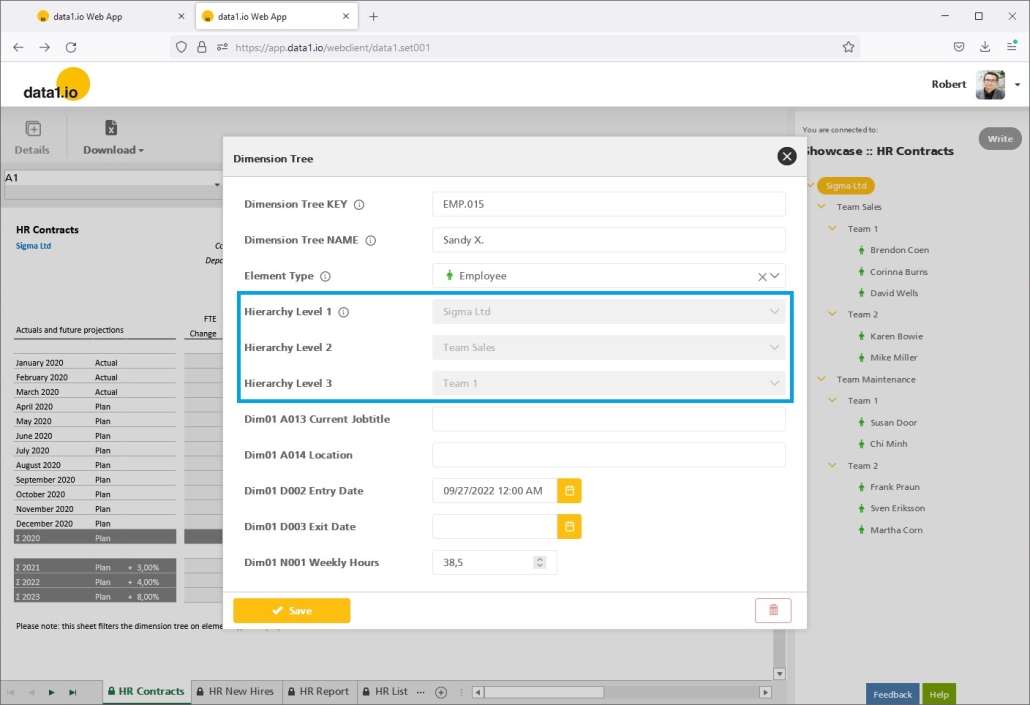
(4) Dimension Tree: New Edit additional Attributes

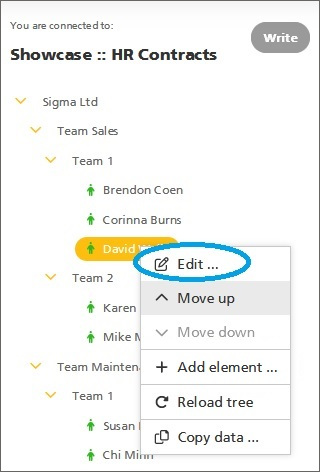
We have upgraded the Edit/Add elements function in your dimension tree …

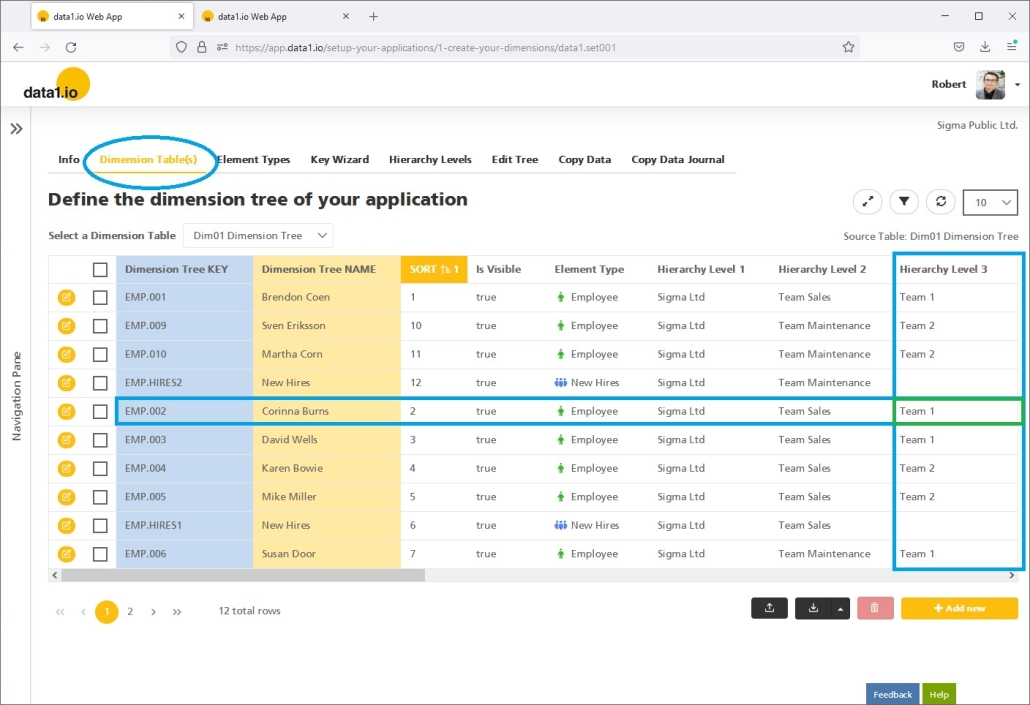
… it is now possible to edit all attributes from your dimension tree and not only the Key, the Name and the Element Type:

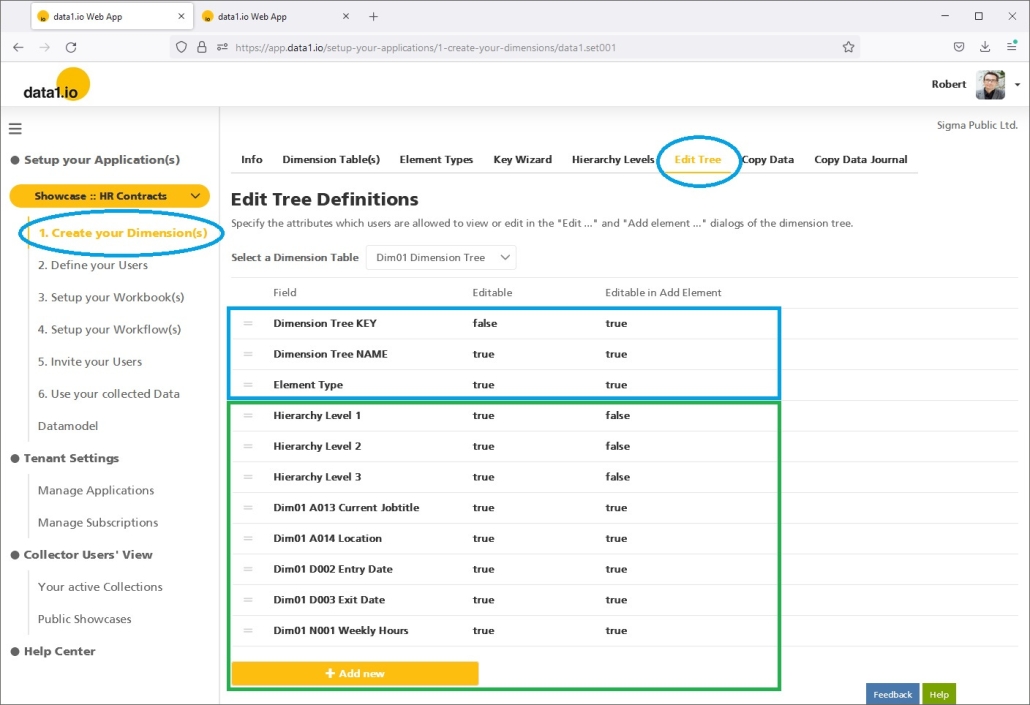
The definitions of the editable attributes are set in the new menu item Edit Tree. Simply add the attributes to the list and define which ones are editable:

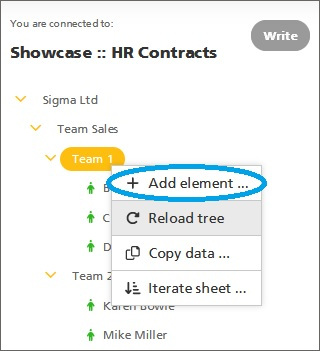
The definitions are applied also to the Add element function …

… often it makes sense to leave some attributes not editable when creating a new element:

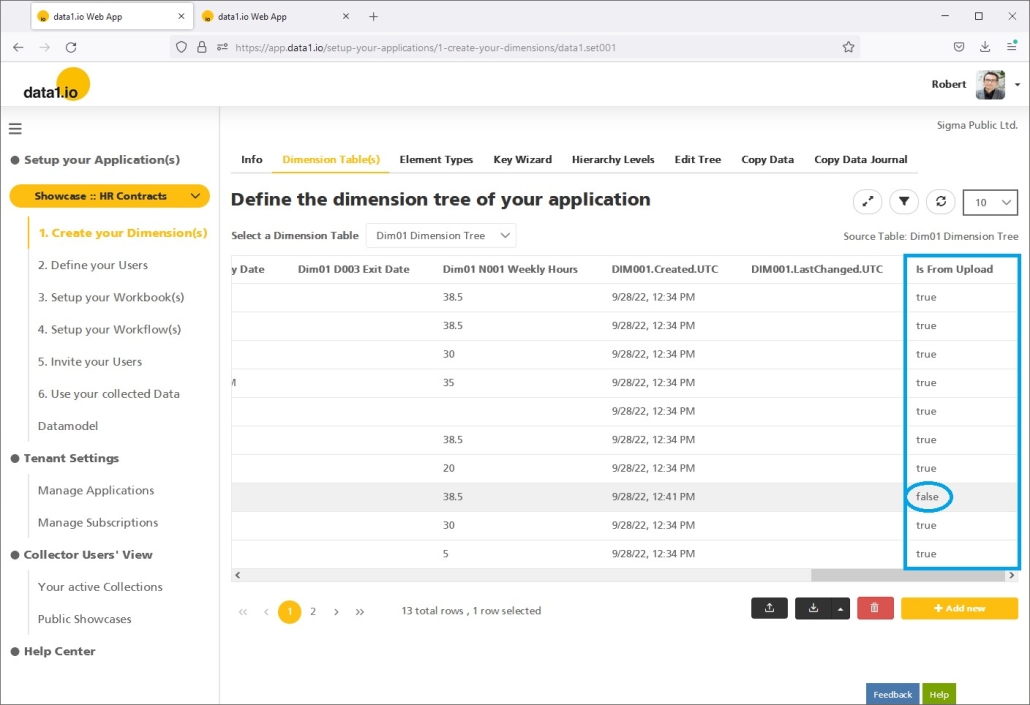
(5) Dimension Tree: New Edit/Import Flag

We have added the new column “Is From Upload” to the dimension tree table. With this information you can see differentiate which elements were uploaded and which elements were created manually:

(6) Dimension Tree: New Reload Function

We have added a Reload tree function to the context menu. With this function you can reload the dimension tree without refreshing the whole page after changes were made (e.g. in the dimension table in the Web App).

(7) Dimension Tree: New Search Function

In large dimension trees it can be difficult to find the right element. Therefore we have added the new search bar for the dimension tree which is shown as soon your dimension tree has more than 50 elements:

Simply type your search term to get the tree filtered:

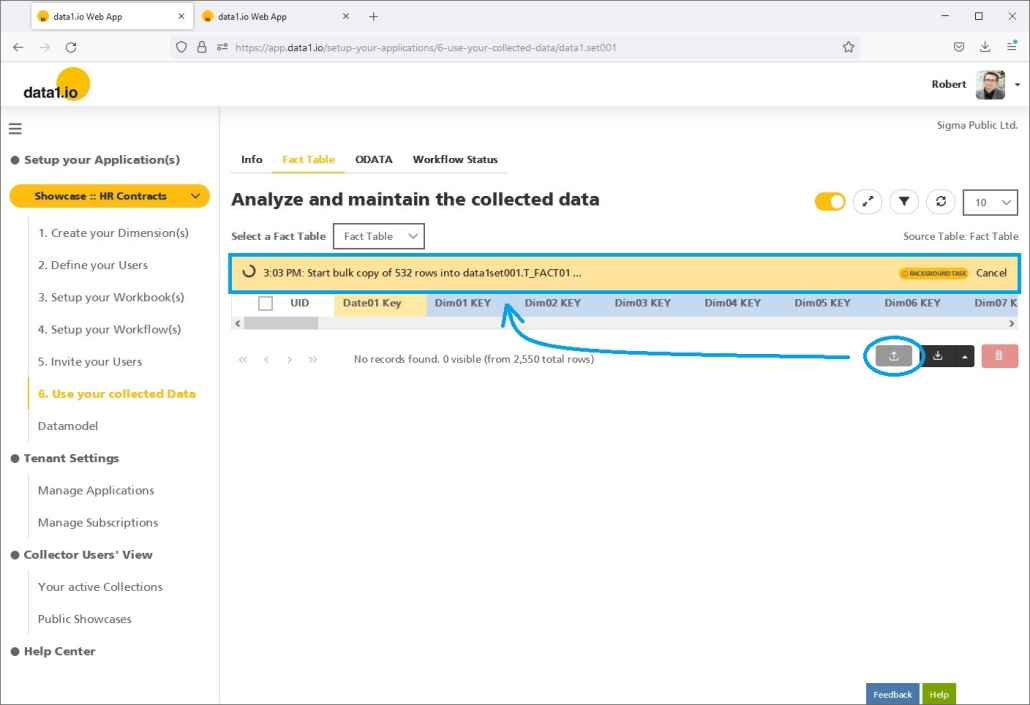
(8) Web App: New Background Tasks for Uploads

In the July 2022 Release we introduced the “Large Data Improvements for Uploads“. In this release we’ve finally solved the issue of uploading large data with the introduction of the new background tasks.

Starting an upload into a table starts the background task, you see it in the new Background Task status bar and you can also cancel the process at any time. The data is uploaded with a paging mechanism from the client into the browser and after that the insert into the table is executed on the data1.io Cloud Service:

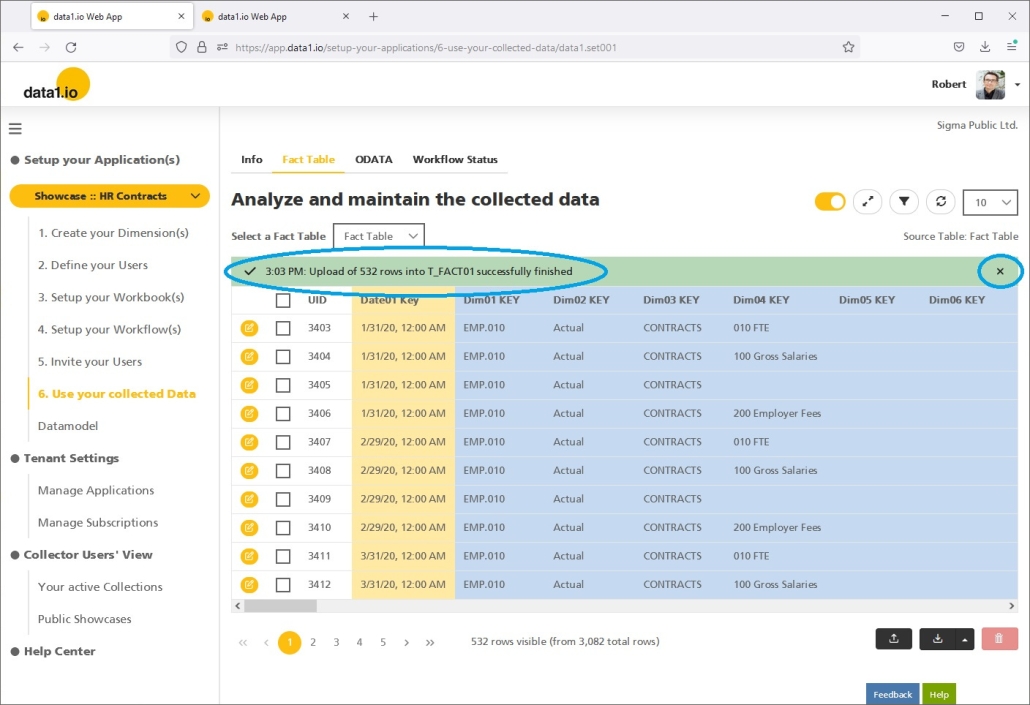
You`ll get a notice when the background task is finished:

(9) Technical Improvements and Debugging

We have solved issues 2 issues with the Always Encrypted feature: TLS 1.0/1.1 was not supported and the measure fields could not be filtered in the Web App. Furthermore there were issues with a sql error on writeback under certain circumstances and with the “Unsaved data” message box when using trigger cells in the workbook.


Hope you like the new features – we are very curious about your feedback! Please let us know what you think and what kind of collection processes you would prefer to automate with data1.io. 

Stay healthy and we #StandWithUkraine

Release July 2022 (before the summer break)

We are happy to deliver the brandnew July 2022 release with the new Forward Projection feature and many other new features! Try it now!

Remember, the Web Client is the user friendly spreadsheet for your Collector Users to deliver their monthly/weekly/daily data. The Web App is the tool for the Power User to setup and control your organization’s collection workflows.

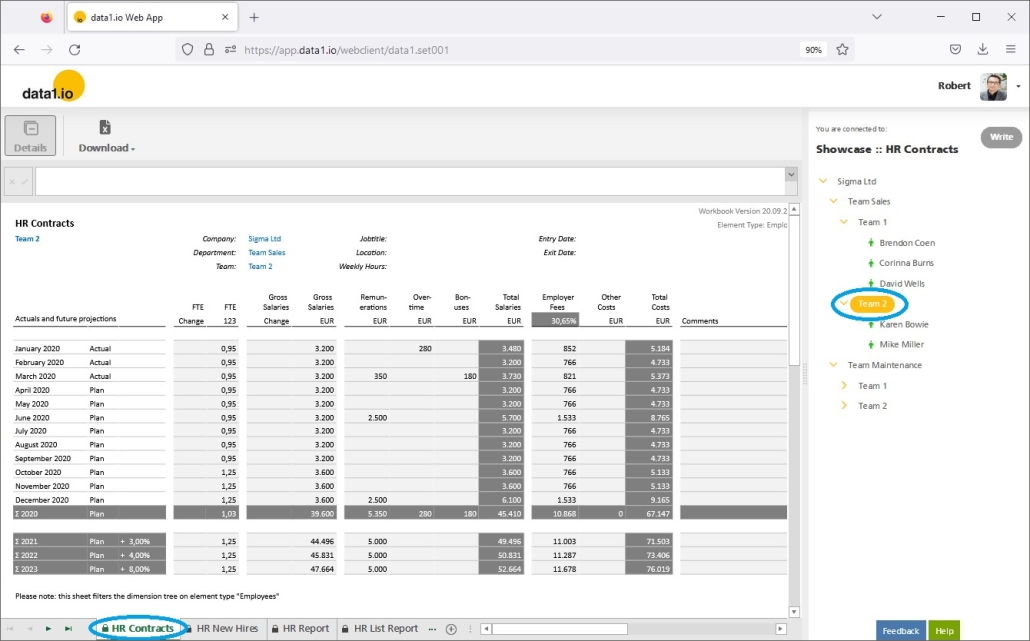
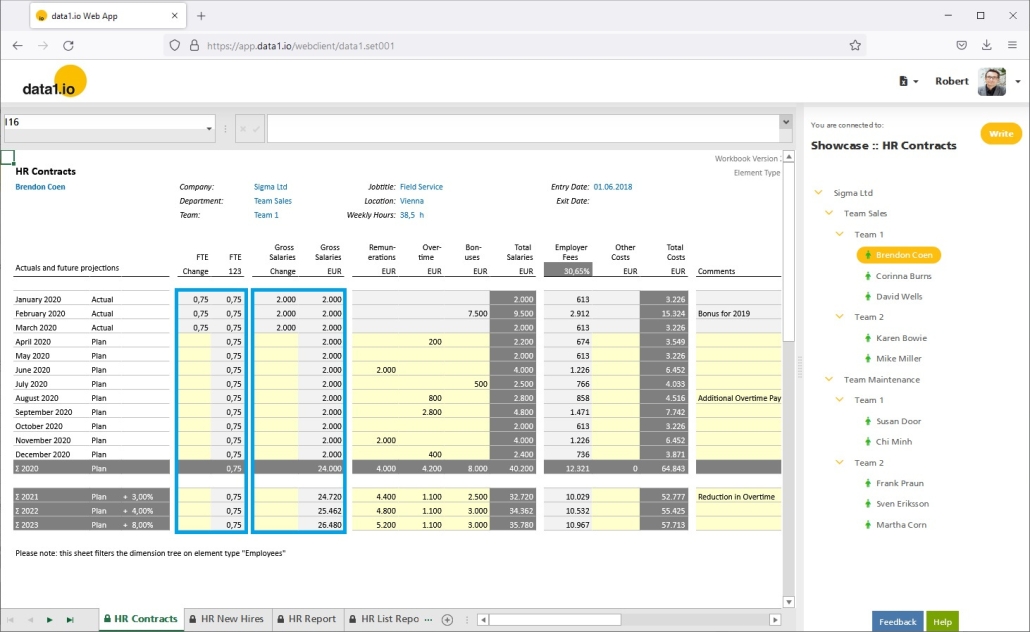
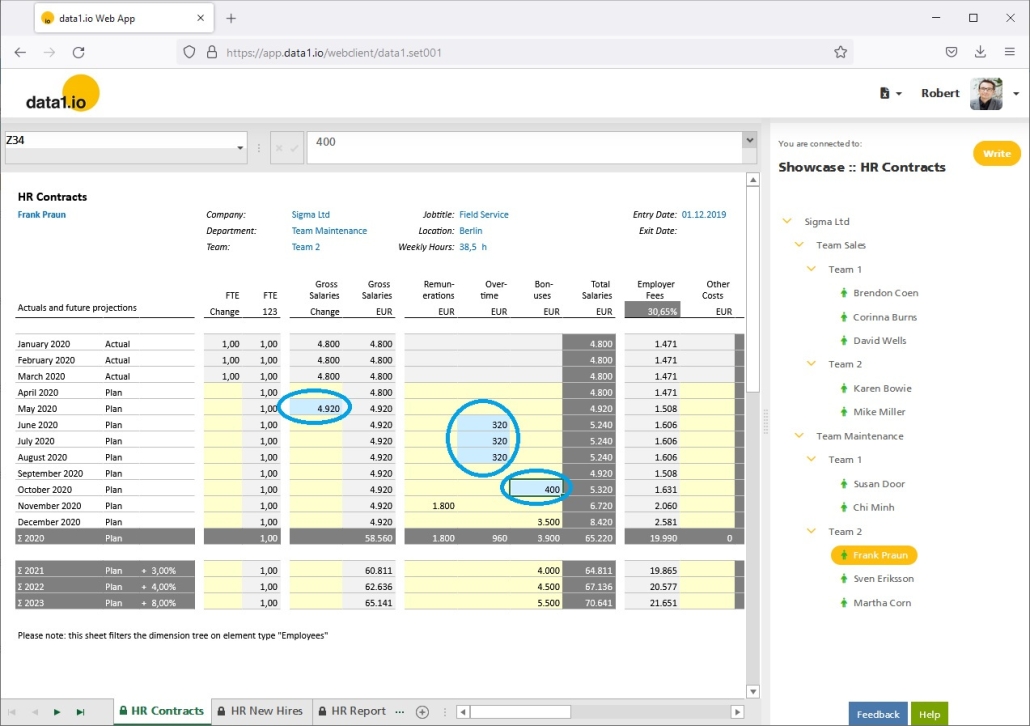
(1) New Forward Projection: Showase “HR Contracts”

We are happy to present a new feature for data forward projection! You can use it to project your Actuals to all periods of the planning horicont …

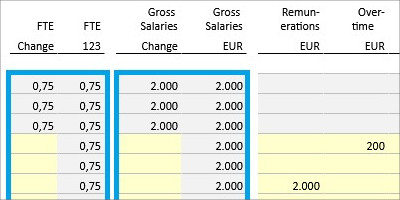
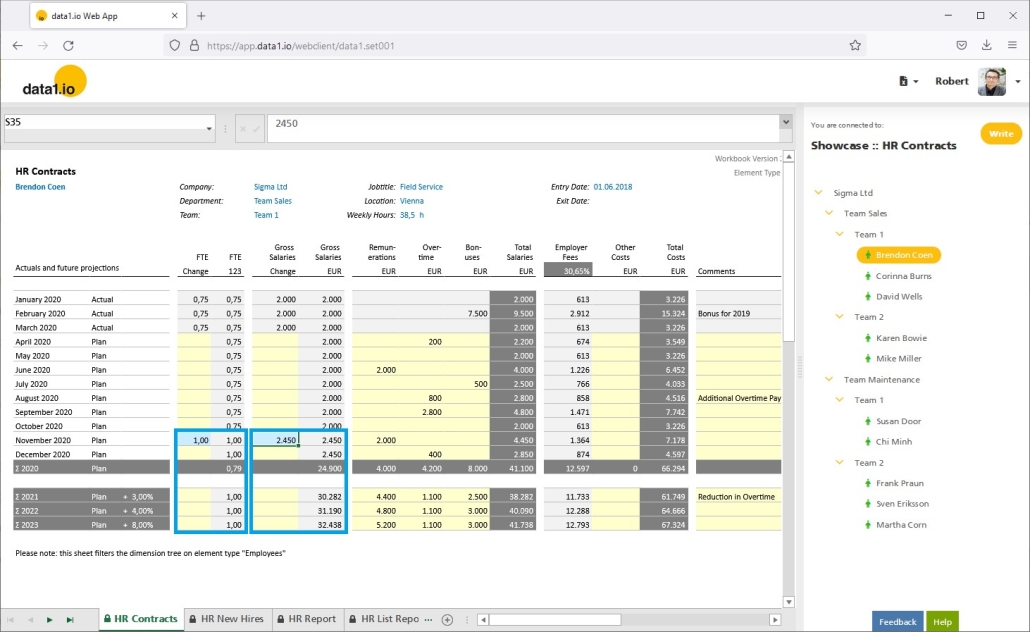
… as well as you can use to realize a “change” logic, which means that your users only have to enter the changes (instead of all periodical values):

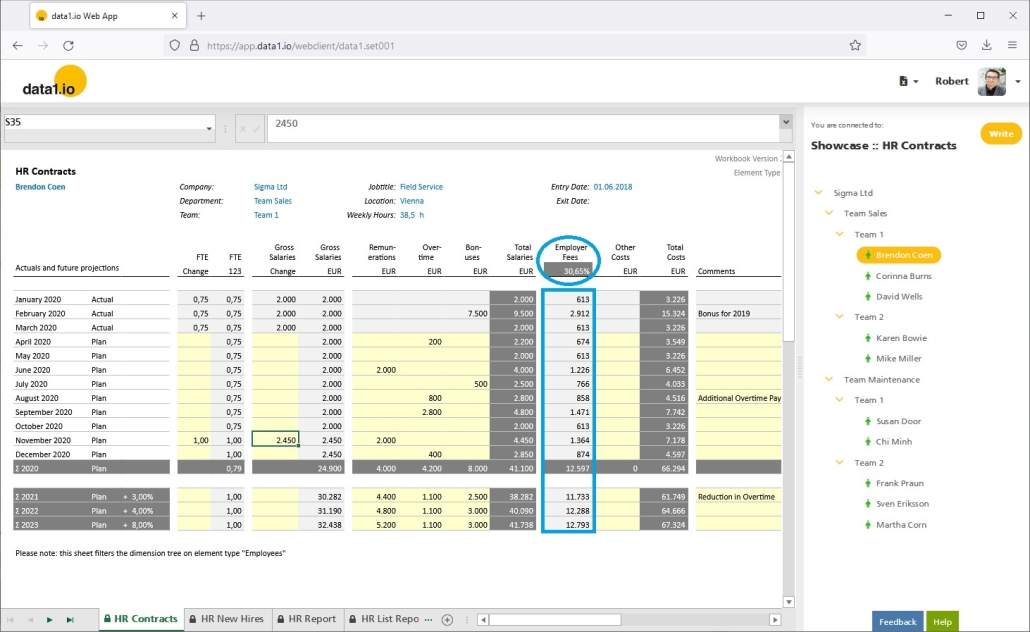
Furthermore we have changed the “Employer Fees” column to a calculated column (so that the users do not have to calculate the values by themselves and edit them after every change):

(2) New Forward Projection: Extended READ Feature

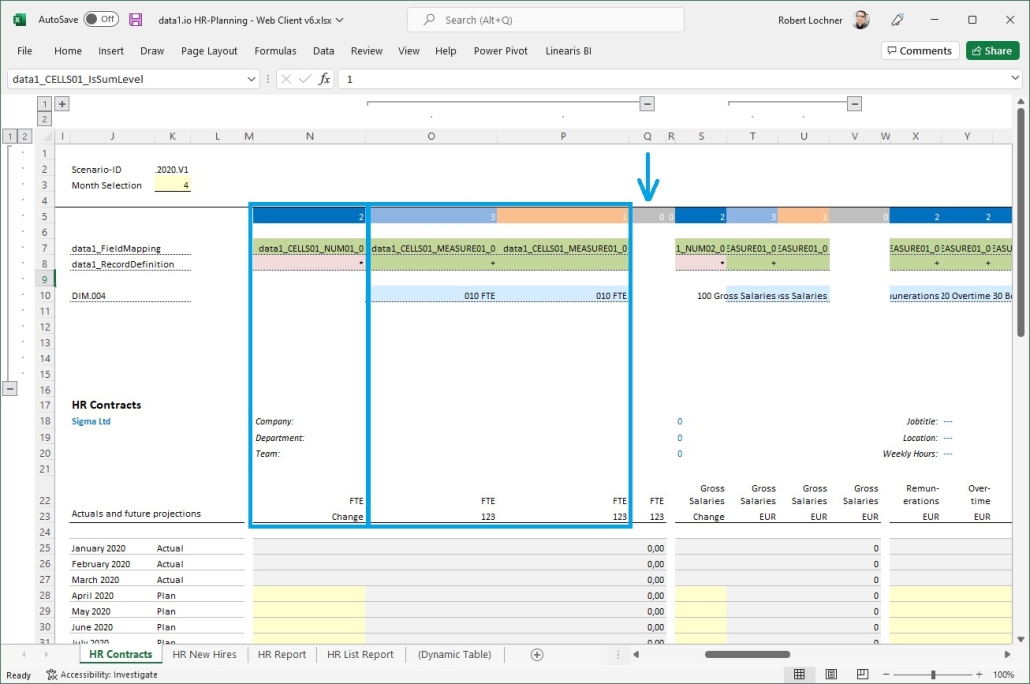
A data entry with forward projection is realized in data1.io with a set of 2 visible und 2 hidden columns:

  1. Column N (Mode 2, visible) = the “Change” value is stored on an attribute of the fact records (here: NUM01)
  2. Column O (Mode 3, hidden) = the calculation of the projected value is done with normal Excel formulas and with a condition for the calculation only on bottom level elements
  3. Column P (Mode 1 or 4, hidden) = the query of the aggregated values is done with a switch for mode “4” on bottom level elements and “1” on aggregated sum level elements
  4. Column Q (Mode 0, visible) = simple sum of column O and P

Before the new release this worked already well for generating the records on WRITING.

But when READING back the values this did not work until now since the “carrier records” for the “change” values (on the fact attributes) could not READ back since the “carrier records” are not READ in the Mode 3 cells (in Column O).

The new extended READ feature makes it now possible, that the “change” values are READ from the attributes even if no “carrier record” is directly READ into the sheet

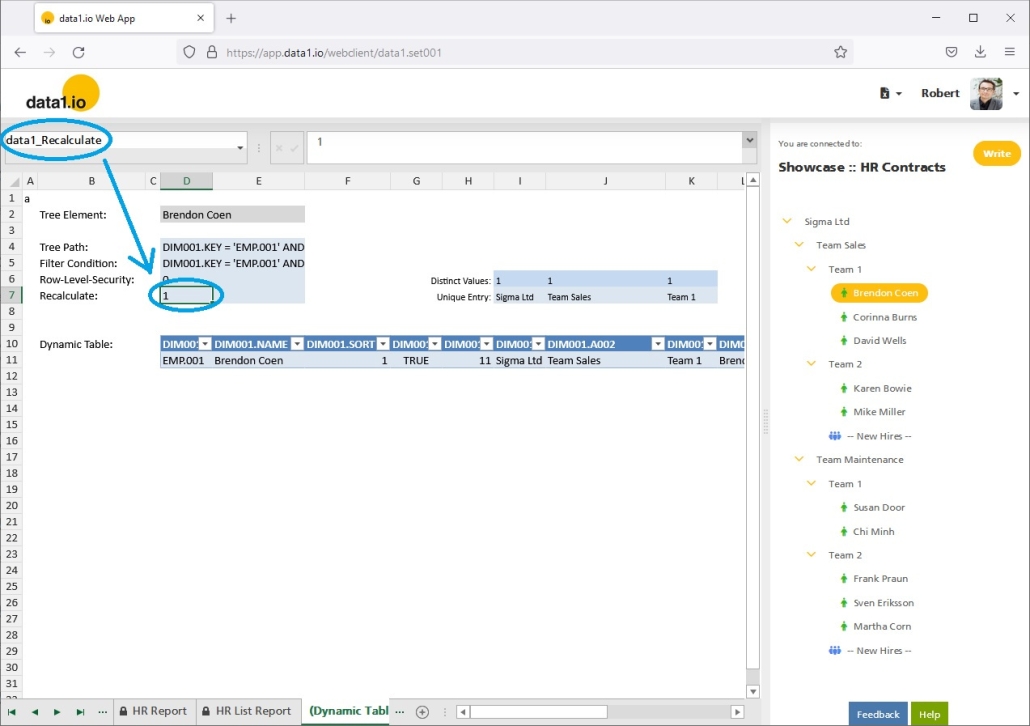
(3) Web Client: New “Recalculate” Parameter for Dynamic Tables

Until now every refresh of a dynamic table triggered automatically a “Recalculate” of the workbook formulas.

With the new Parameter

  • data1_Recalculate
    0 = Do not recalculate
    1 = Do recalculate

you can control now this behaviour.

The READ process is faster when the RECALCULATE is not done (value = 0). Some spreadsheet functions like INDEX() need an RECALCULATE to show current results, others do not need it. Please test in your own application if you can set the parameter to “0” and gain performance on refreshing the dynamic tables in your workbook.

(4) Web Client: “Changed Cells” Improvements

We have further improved the “Changed Cells” highlighting feature:

  • Support for Dark Themes
    e.g. black cell background and white font color
  • Support for Exception Type definitions
    e.g. data1_CELLS01_ExceptionType2

(5) Web App: Security Improvements

We have improved the security for ODATA and API calls with a new role-based security concept and make the data1.io application this way more powerful.

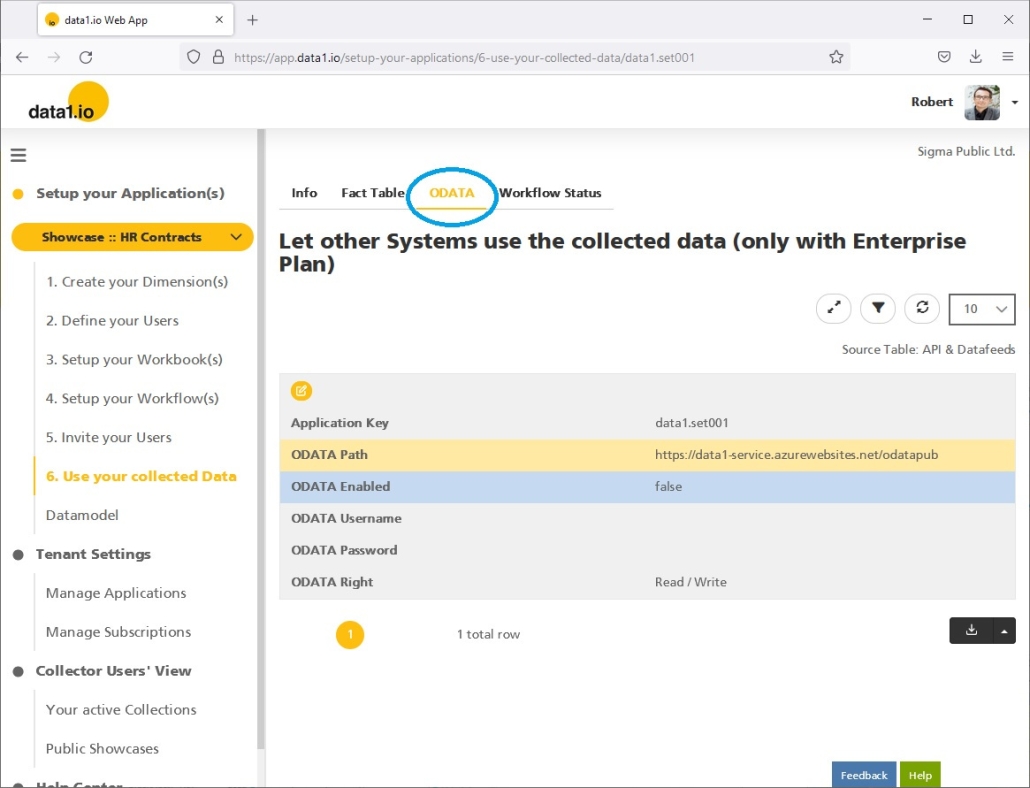
(6) Web App: Large Data Improvements for ODATA

In order not to run into timeouts when using the ODATA Feed we have implemented two major functions:

  • Paging Mechanism
    This means that the records are delivered in sets of 10.000 records and not all at once.
  • Query Parameters
    This means that you can – and should – use a filter on the actually needed records and columns.
    The Query Parameters are added to the ODATA URL like this:
    http://data1-service.azurewebsites.net/odataprivate/appXJL2SSUJ7W/APP_FACT01
    ?$filter=SYSTEM_IsDeleted eq false
    &$select=FACT01_UID,DIM001_Key,DIM002_Key,DIM003_Key,DIM004_Key,DIM005_Key,MEASURE01,DATE01_Key,NUM01

(7) Web App: Large Data Improvements for Uploads

Until now the limit for uploading files was 28,6 MB per file …

… if you tried to upload such a file then you got this message:

We have extended this size limit now from 28,6 MB to 300,0 MB.

Please be aware that there is one issue left: when uploading such a file you will get this message after a few minutes …

… but the upload continues on the server and it will finish later. We will address this remaining issue in a future release.

(8) Web App: Improved Hierarchy Level Definition

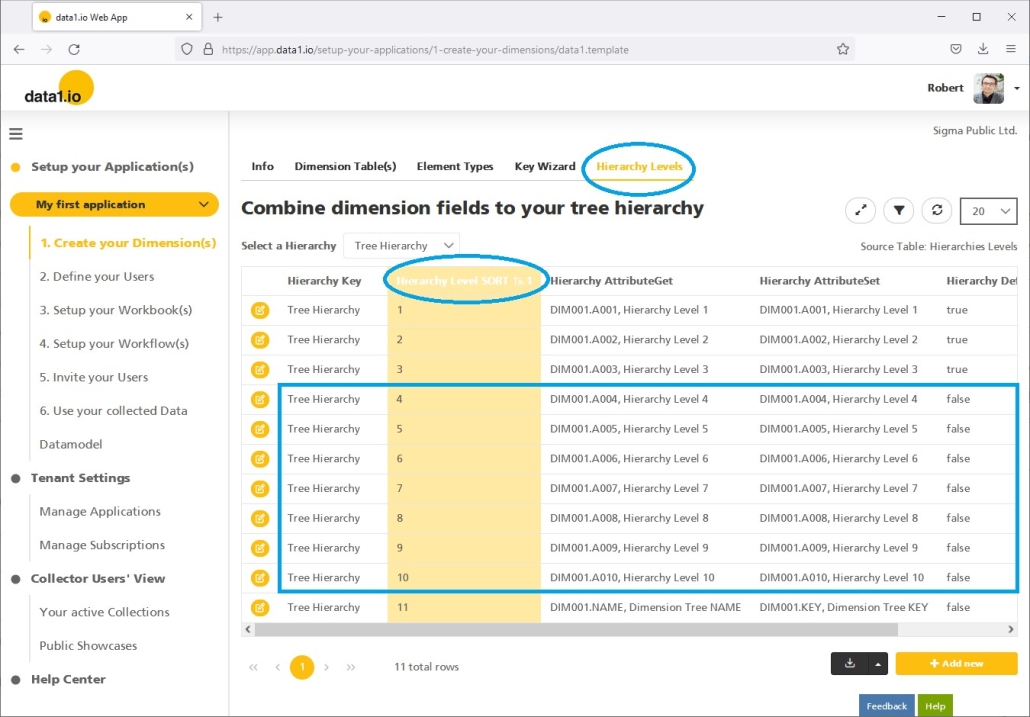
Until now, the default definition for the Hierarchy Levels contained only the first 3 Level fields and the KEY/NAME field on the 4th level. We have changed that and in all new data1.io applications the hierarchy levels are defined up to the maximum of 11 levels, so there is no need to maintain this definition any more. Furthermore we have renamed the SORT field in order to automatically sort the list correctly.

Please evaluate in your own application to fill up this hierarchy level definition in order to be free of maintenance when increasing the number of dimension tree levels.

(9) Technical Improvements and Debugging

We have restricted dropdowns the Hierarchy Level definitions attributes only from the “Dim01 Dimension Tree” table.

There was another issue with allocating Collector Users to deleted applications.

An there was an issue with the column width in the “Sent E-Mails” section.

Last but not least we solved an issue with the quite new data1_Treefilter – it did not work with columns which had more than one dot (.) in their column name (e.g. DIM001.DIMTYPE.UID).


Hope you like the new features – we are very curious about your feedback! Please let us know what you think and what kind of collection processes you would prefer to automate with data1.io. 

We`ll be back after the summer break with the September Release!

Stay healthy and we #StandWithUkraine

Release June 2022

We are happy to deliver the brandnew June 2022 release with the next level “HR Contracts” showcase which is enabled by many new features! Try it now!

Remember, the Web Client is the user friendly spreadsheet for your Collector Users to deliver their monthly/weekly/daily data. The Web App is the tool for the Power User to setup and control your organization’s collection workflows.

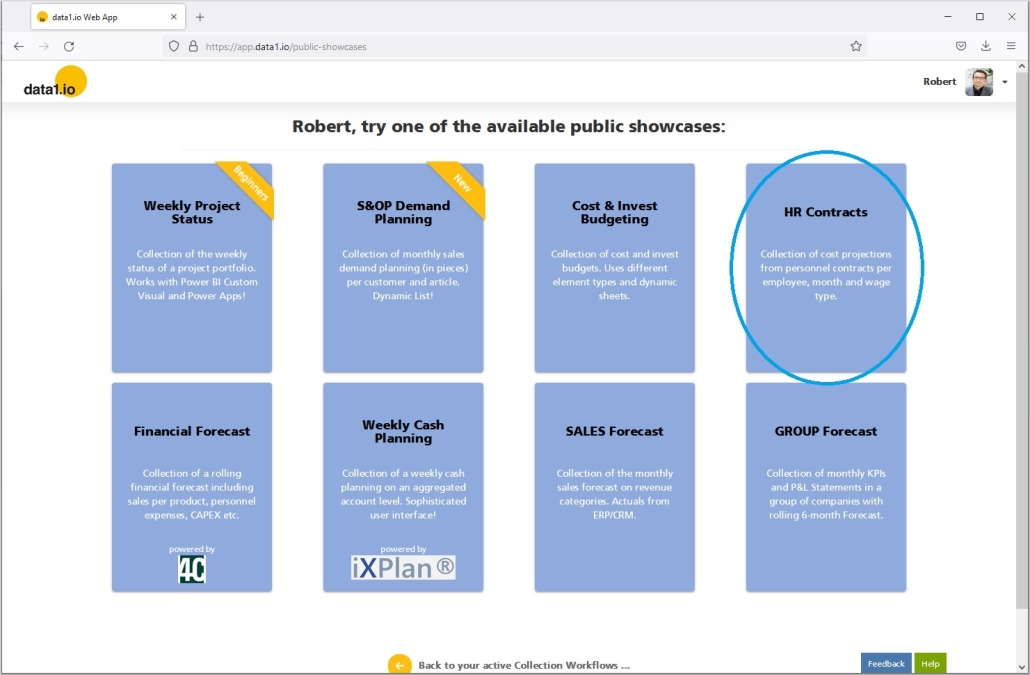
(1) Next Level “HR Contracts” Showcase

We have upgraded our showcase “HR Contracts” massively this month!

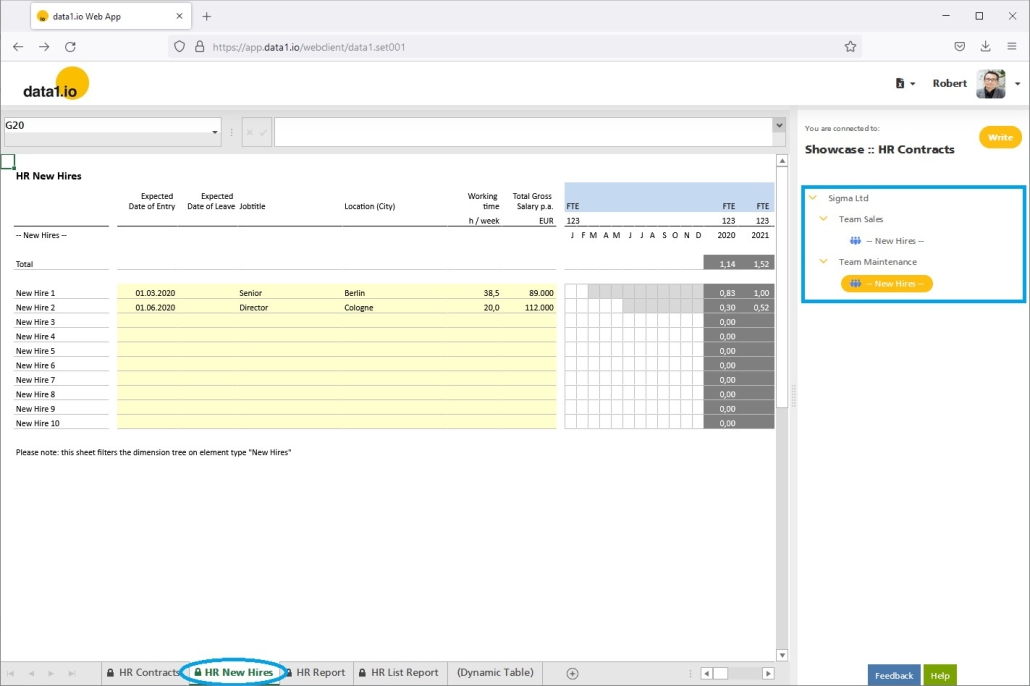
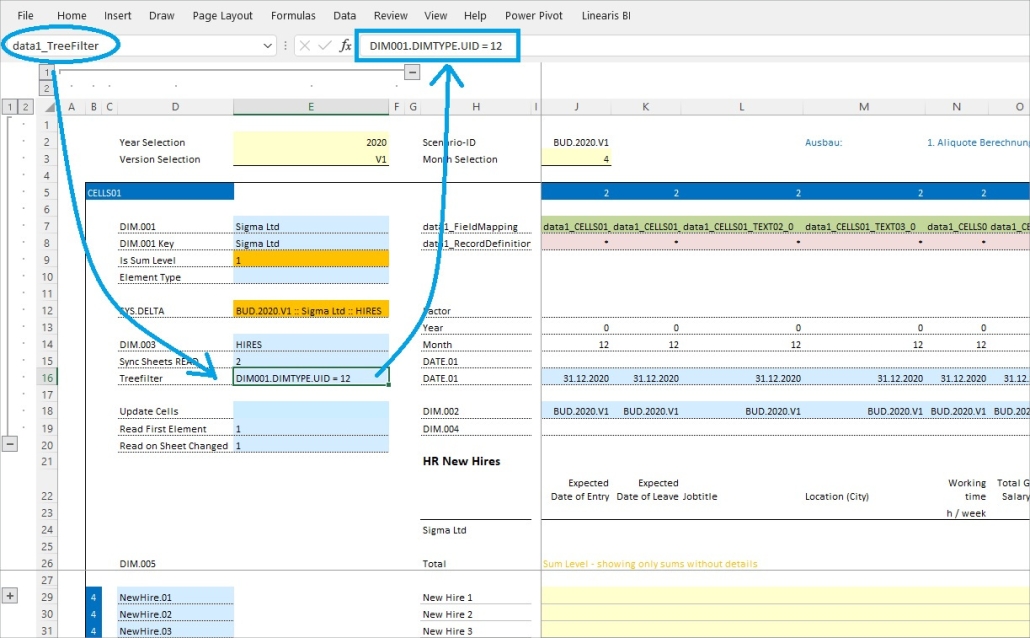
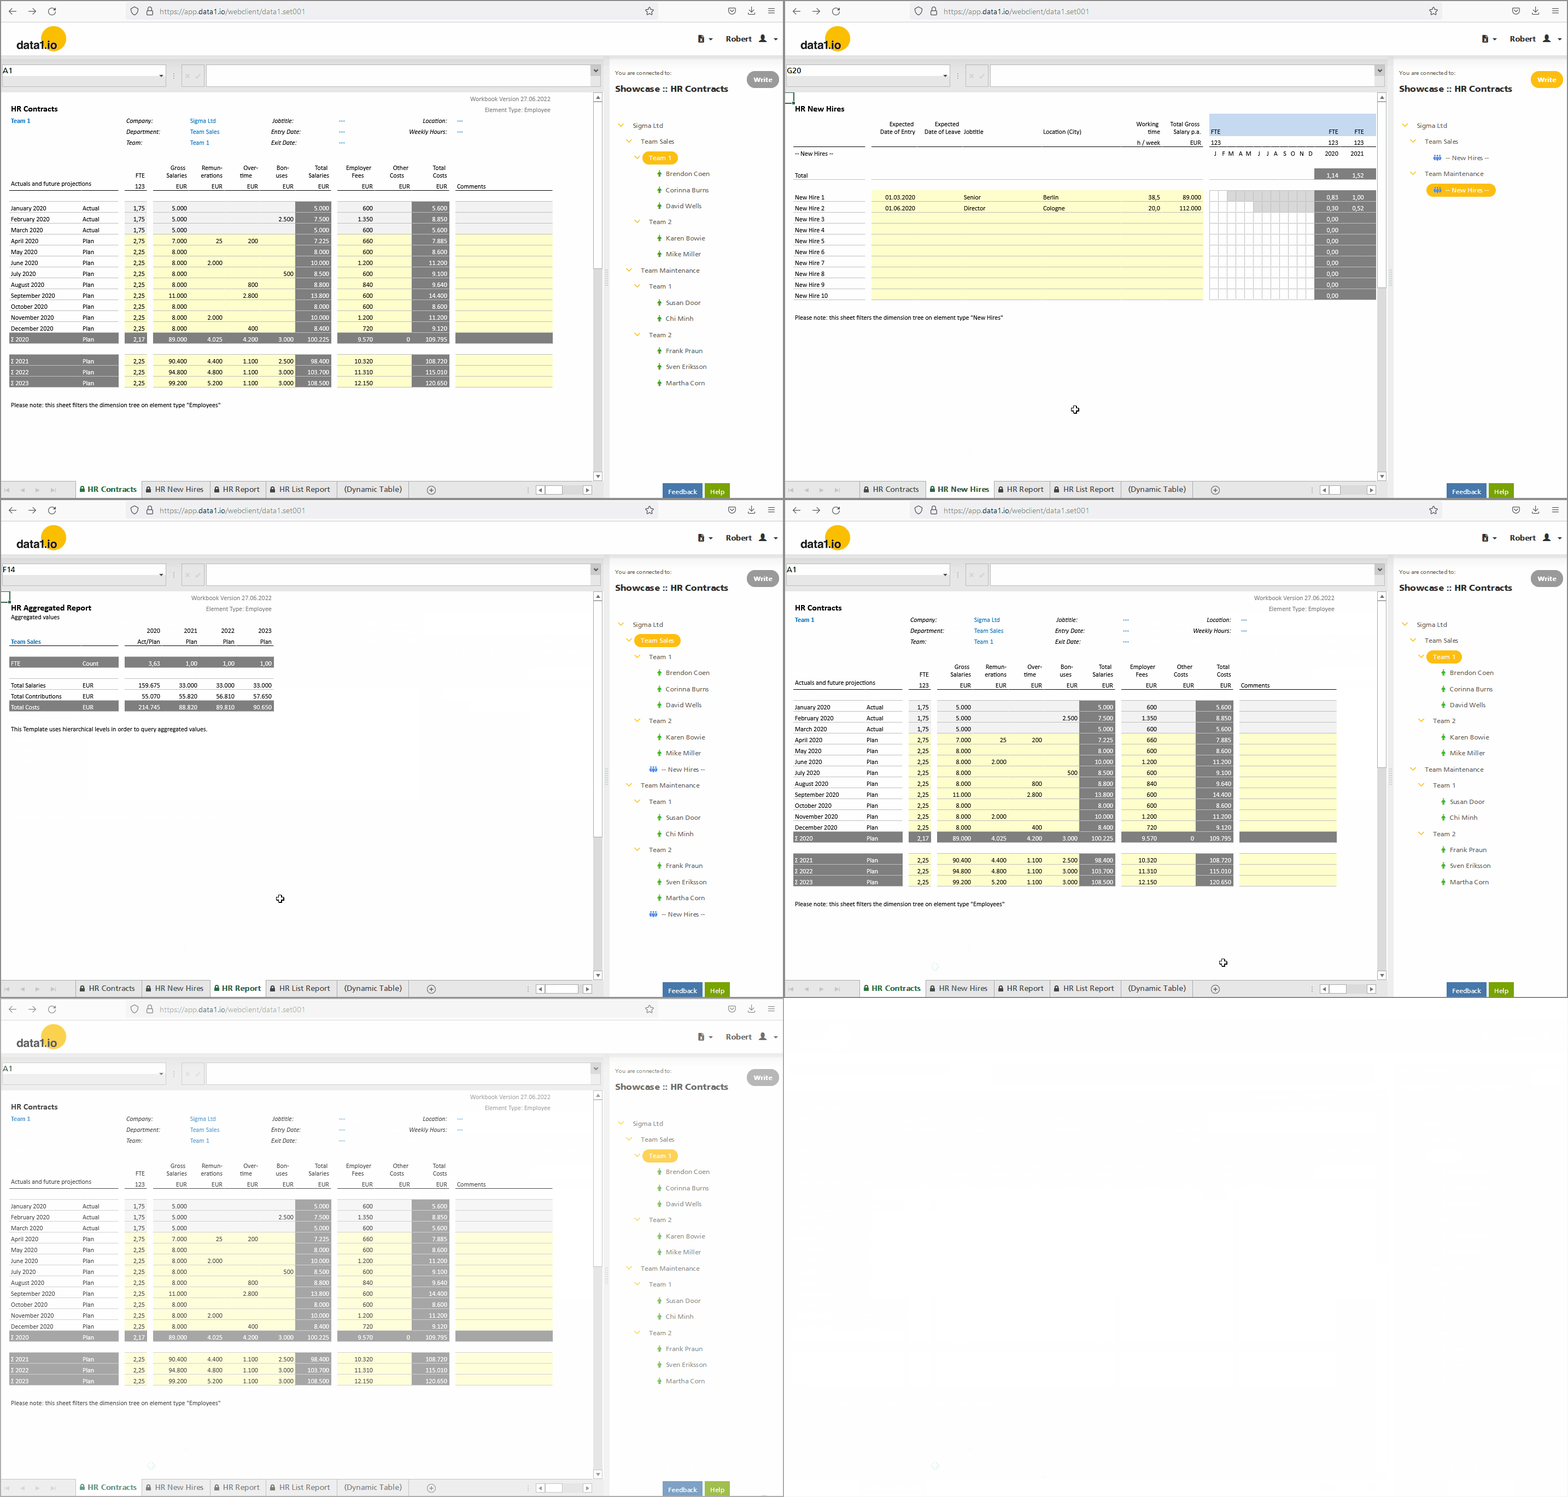
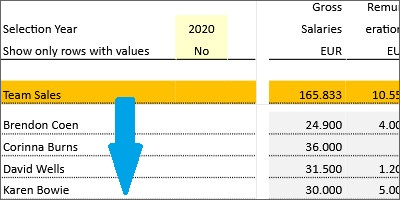
You`ll find a new data entry sheet “HR New Hires” with a dimension tree that is filtered to the elementtypes corresponding with that data entry sheet:

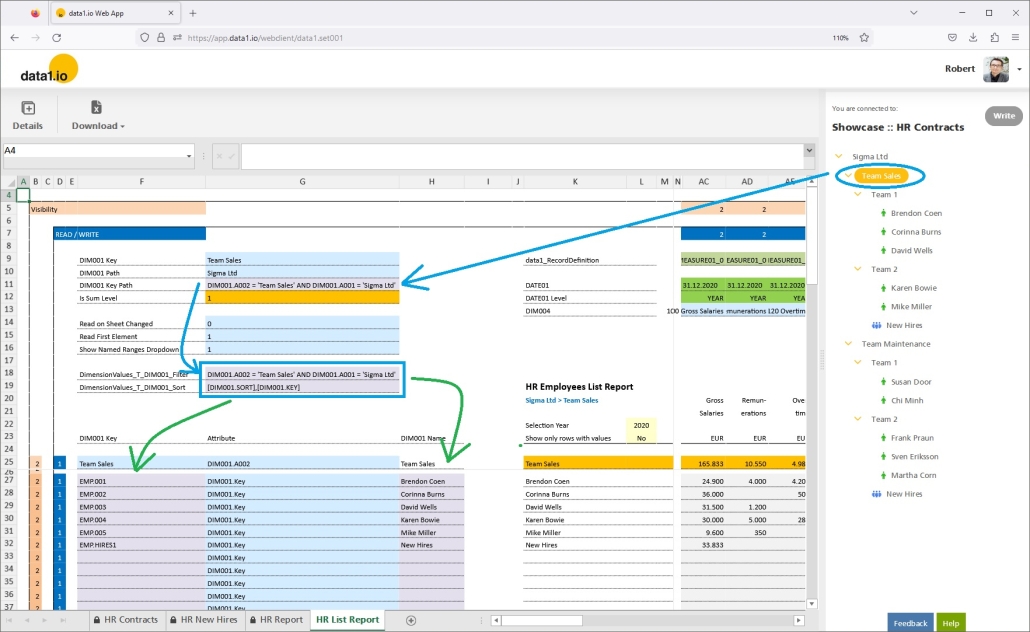
The existing data entry sheet “HR Contracts” has got a dimension tree filter as well to show only those bottom elements in the tree which make sense in this data entry context:

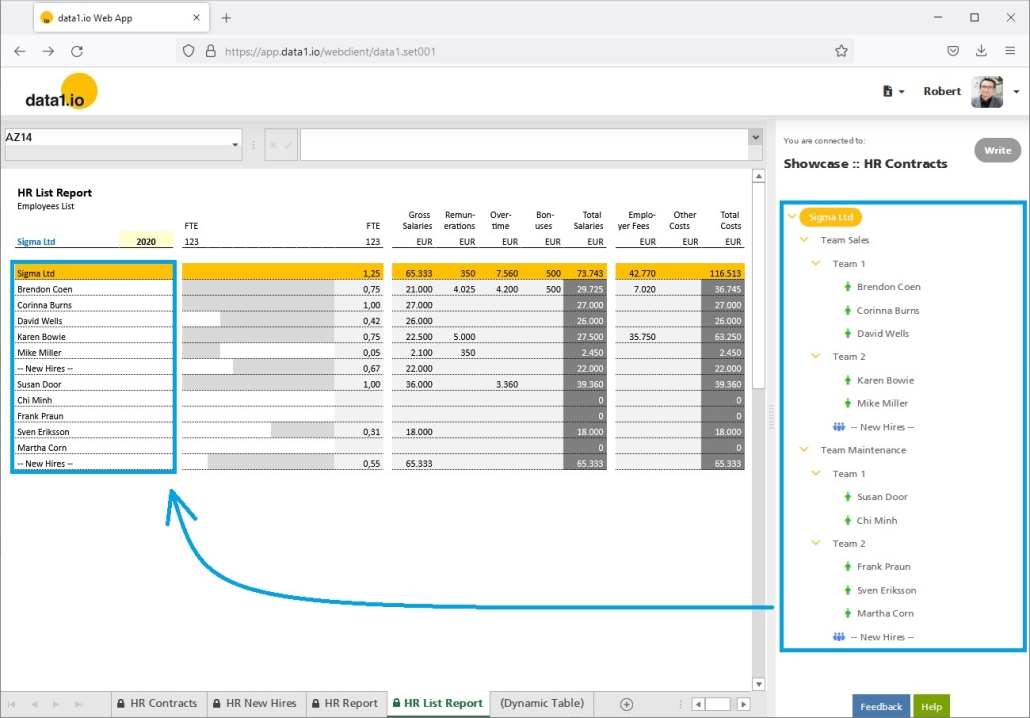
Furthermore we have improved the HR List Report (based on the Dynamic Table sheet), you will see that further down.

(2) Web Client: New Treefilter

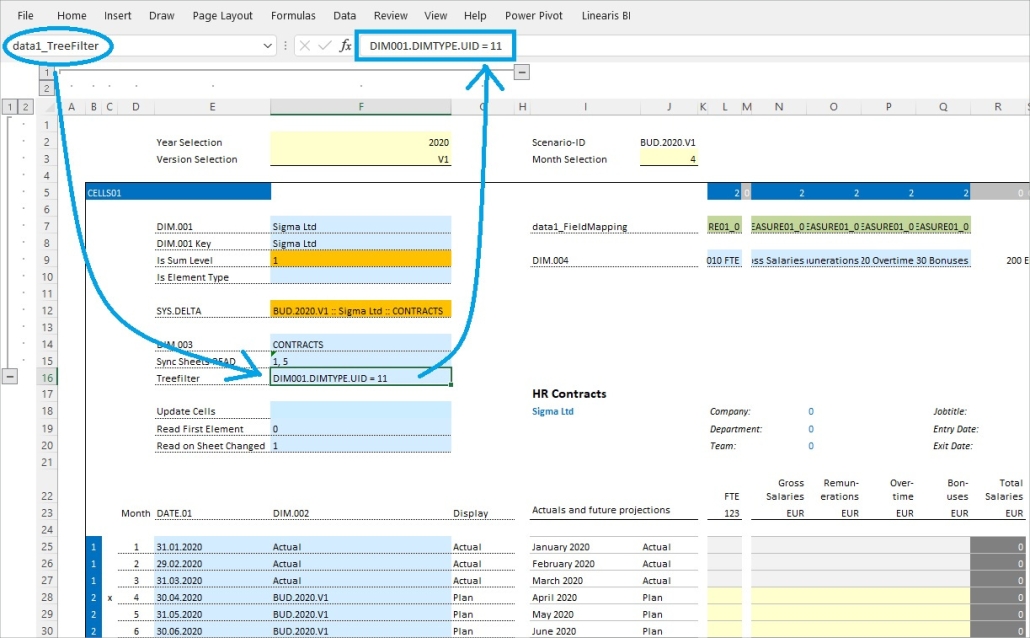
The filtered tree that you can see in the showcase screenshots above is implemented with this new parameter

  • data1_TreeFilter

The syntax for the filter statement is very similar to the WHERE clause of SQL queries. If you filter on element types, then please mind that you have to use the UID number of the element type:

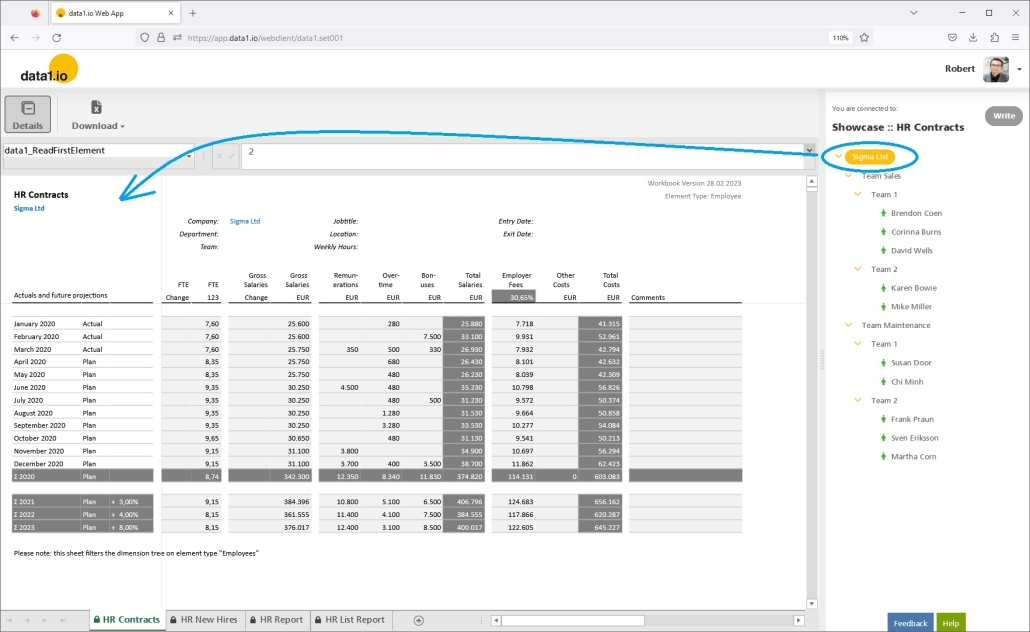
(3) Web Client: New Refresh-Event on Sheet Change

We introduce another

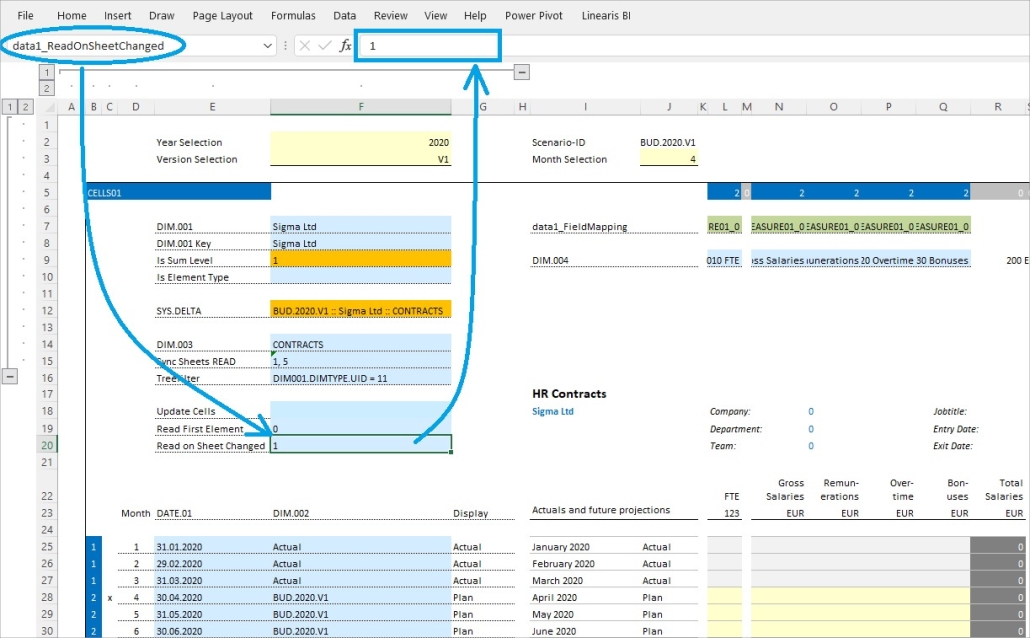
  • data1_ReadOnSheetChanged
    0 = nothing happens when selecting the sheet
    1 = Refresh when selecting the sheet

Simply add this new parameter to every page of your multi-sheet application …

… and the sheet will be refreshed when you select a certain sheet of your workbook:

This is important to make sure to see the current data from the database in the sheet.

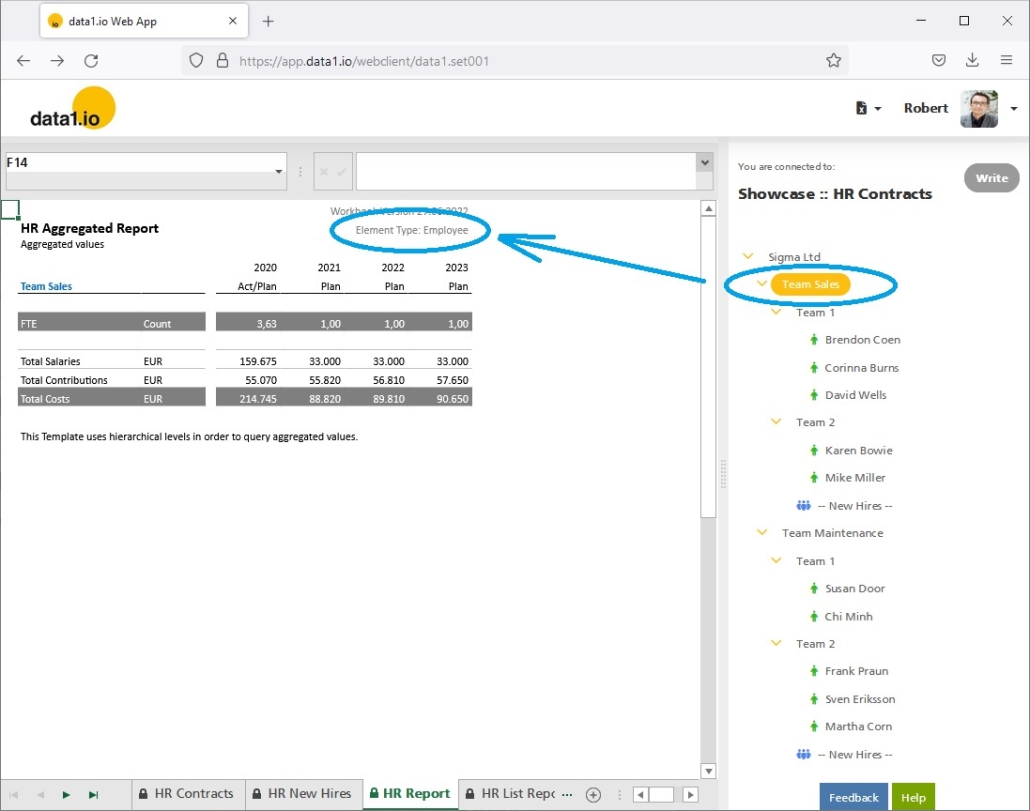
(4) Web Client: Element Types also on Sum Levels

Last month we introduced the new element types and the new parameter which writes the element type from the selected element into the workbook:

  • data1_CELLS01_DIM001_Type

With this release, this parameter delivers now also on all sum levels the element type of the first found bottom element below the selected sum element:

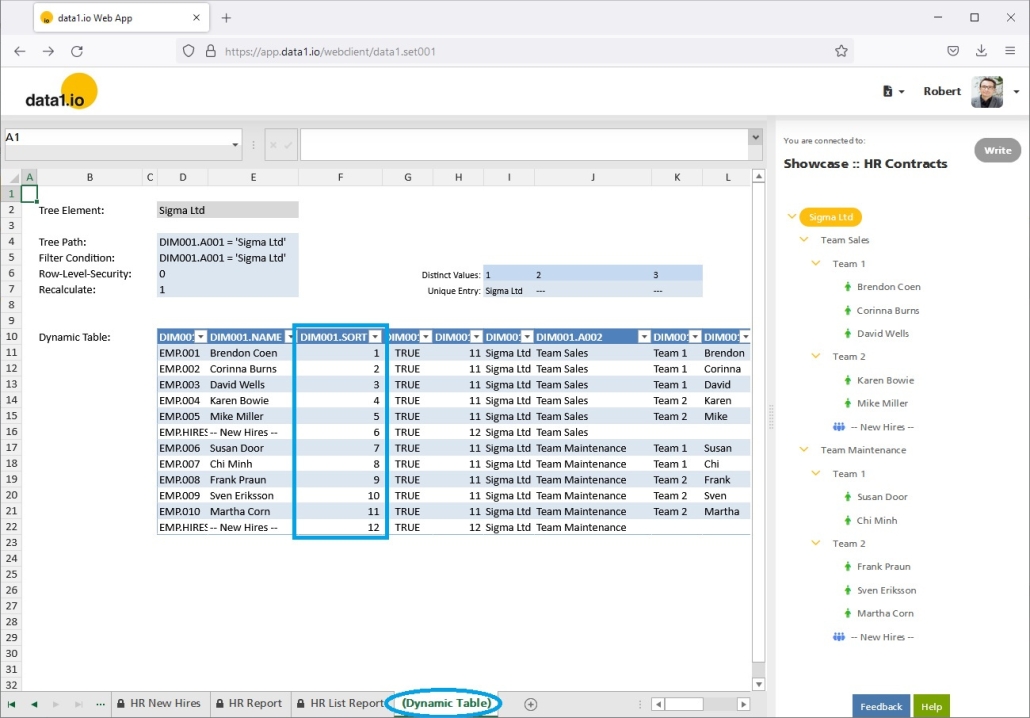
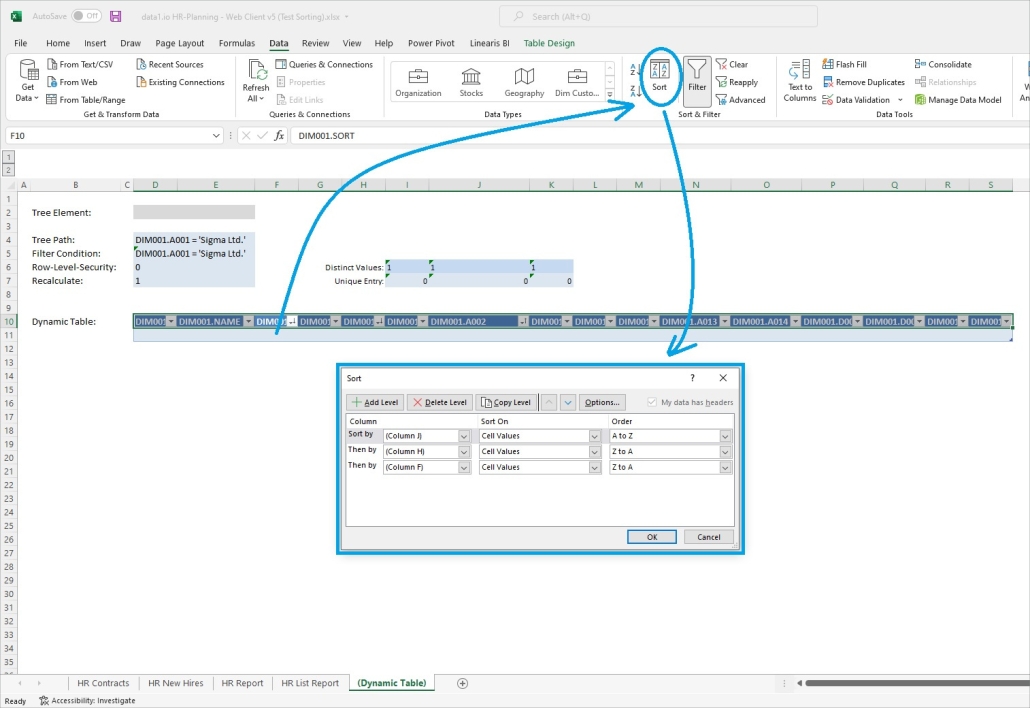
(5) Web Client: Dynamic Tables Sorting

With this release, the sorting of dynamic tables is not randomly anymore:

You can see the sorting in the sheet “(Dynamic Tables)”. By default a dynamic table is sorted now by the field DIM001.SORT the same way as the dimension tree is sorted:

Furthermore you can define a custom sort order in MS Excel (before you upload the file into your data1.io application):

(6) Web Client: Dynamic Tables Performance Improvement

We have improved the READ performance of dynamic tables by a factor of about 50 %. This was possible since in the background the data entry validitiy rules for the table were loaded and this is not necessary for dynamic tables in the spreadsheet.

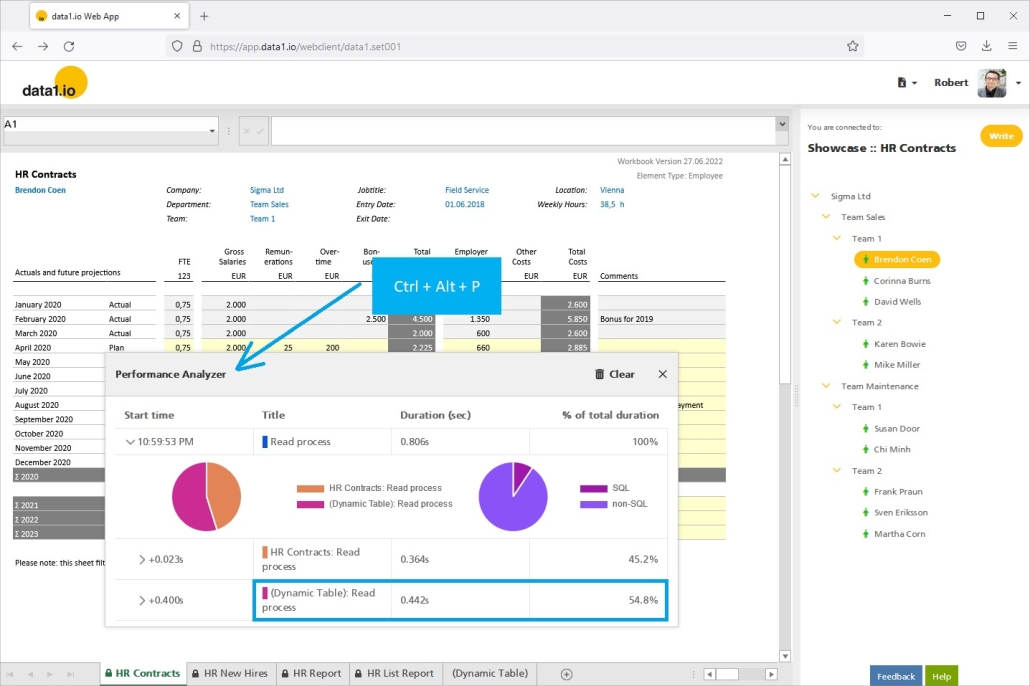
(7) Web Client: Dynamic Tables in Performance Analyzer

We have added the READ process for dynamic tables to the Performance Analyzer (launch with Ctrl + Alt + P). This way it is easy to evaluate the impact of a dynamic table to the READ performance of your application:

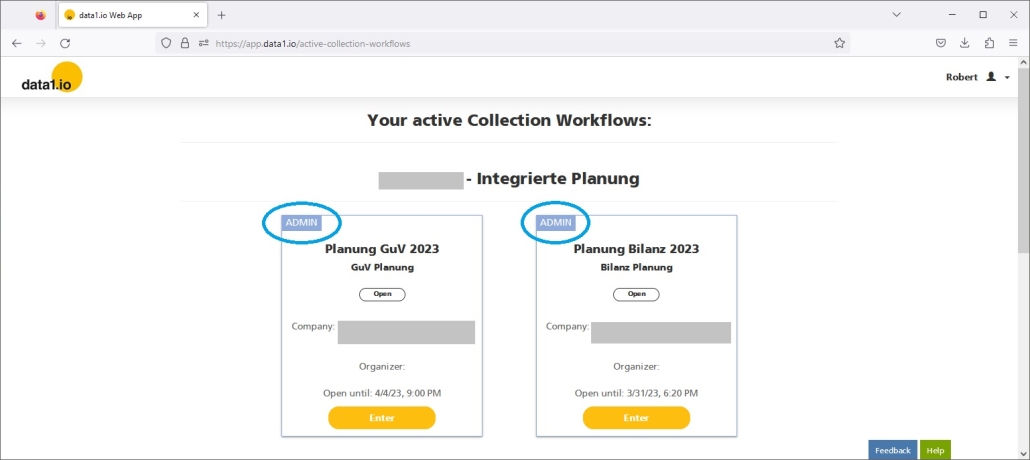
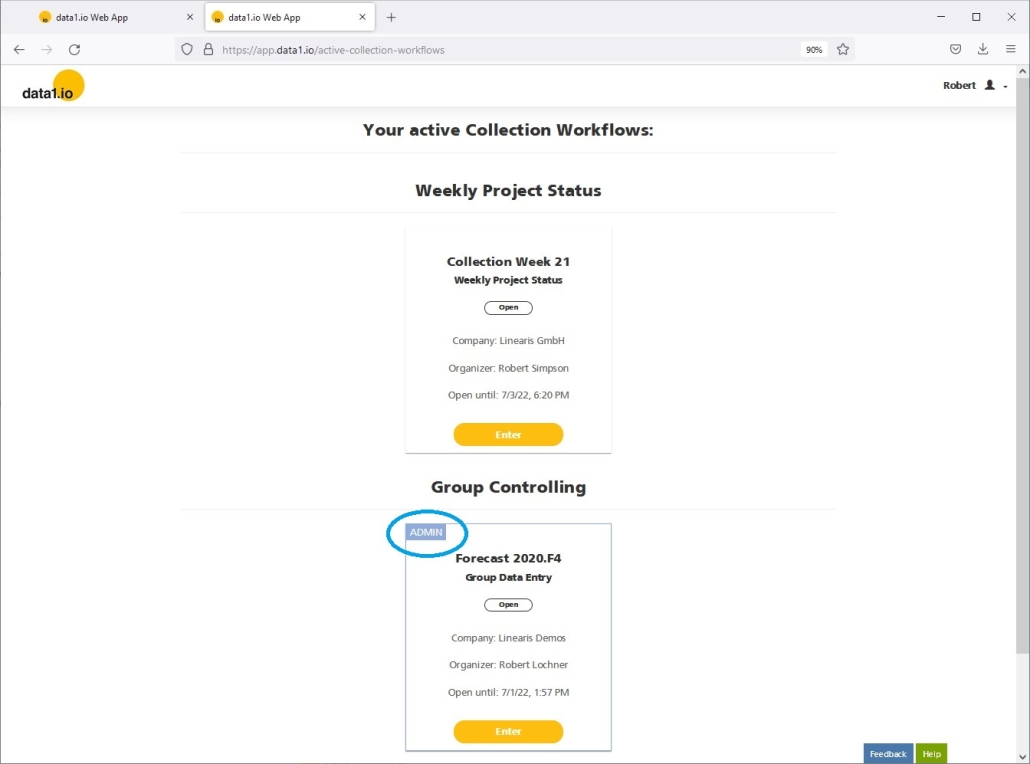
(8) Web Client: Admin Widget on the Application Tile

As a Power User you can use the link Your active collections

… to get to your active collections. If you are at the same time Collector User for external applications, it is now very clear which applications are your own since the application tiles are marked with an Admin widget:

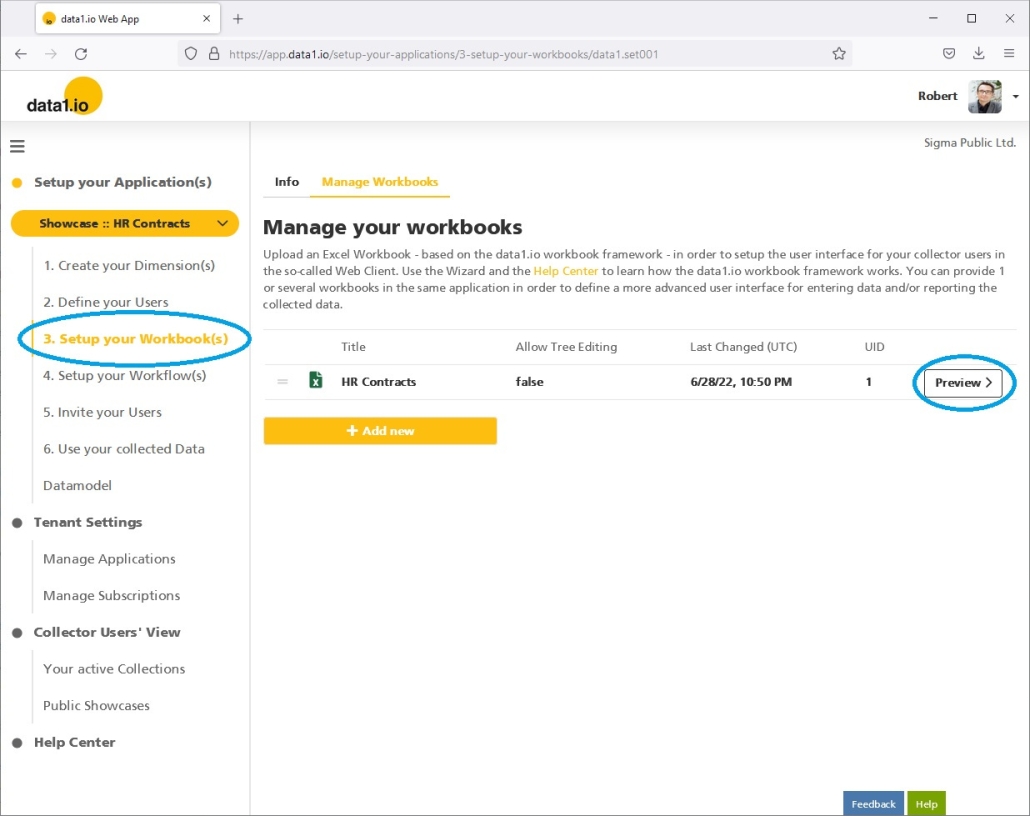
(9) Web App: New Workbook Preview Experience

We are happy that we have improved the Workbook Preview experience …

… by removing all RLS and Workflow settings from this preview:

This was very tedious until now, since you had to setup a valid workflow definition (validity period and allocation to the workbook) and a valid RLS definition just to be able to preview your workbook. Especially when you setup your own application the first time this is much clearer now and easier to understand than before.

(10) Technical Improvements and Debugging

We removed a bug that multiplied the application number of tiles on the applications landing page and furthermore we removed another bug concerning %-Level aggregations.


Hope you like the new features – we are very curious about your feedback! Please let us know what you think and what kind of collection processes you would prefer to automate with data1.io. 

Stay healthy and we #StandWithUkraine
Release May 2022

We are happy to deliver the brandnew May 2022 release with the new element types for a more powerful user experience! Try it now!

Remember, the Web Client is the user friendly spreadsheet for your Collector Users to deliver their monthly/weekly/daily data. The Web App is the tool for the Power User to setup and control your organization’s collection workflows.

(1) Web Client: New Element Types

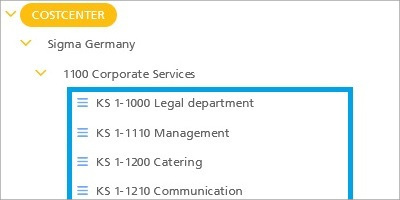
At first sight, element types help you to structure the bottom level of your dimension tree with symbols:

As a Power user you can easily define as many element types as you like just by clicking the Add new button in the new Element Types section …

… and just defining a type name, an icon and an icon color:

Now you can allocate your dimenson tree elements to one of the defined element types:

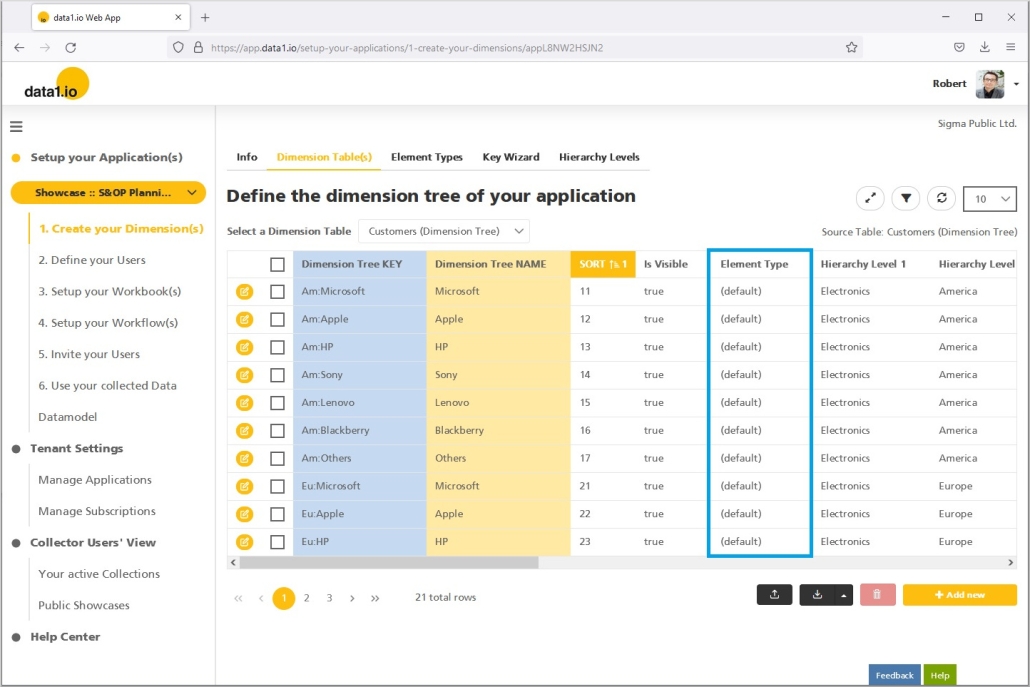
If you decide not to use element types then you will see a “(default)” entry on every element not allocated to an element type:

(2) Web Client: New Parameter for Element Types

More important than the symbol in the tree is the possibility to define specific data entry workflows to each element type. For this reason we introduce the new parameter

  • data1_CELLS01_DIM001_Type

With this parameter you can control e.g. the visibility settings of the sheets:

Please be aware that this parameter delivers at this time a null / blank when selecting a sum-level element in the dimension tree.

(3) Web Client: New Attributes for the Fact Table

We have massively extended our data model with new attributes for the Fact Table:

  • 20 instead of 10 text attributes
  • 20 new date attributes
  • 20 new numeric attributes

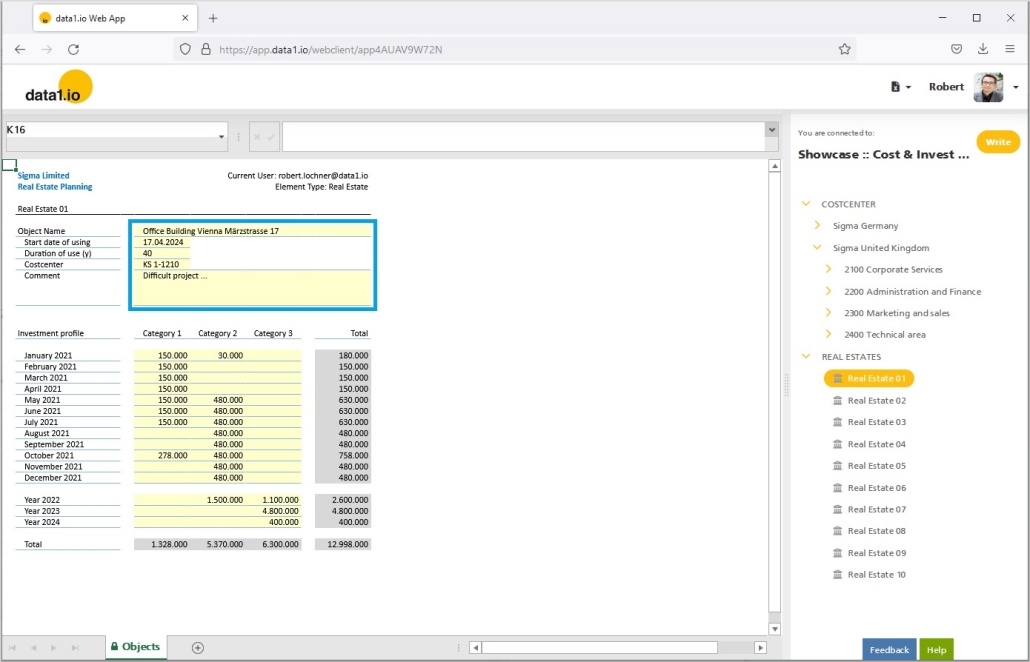
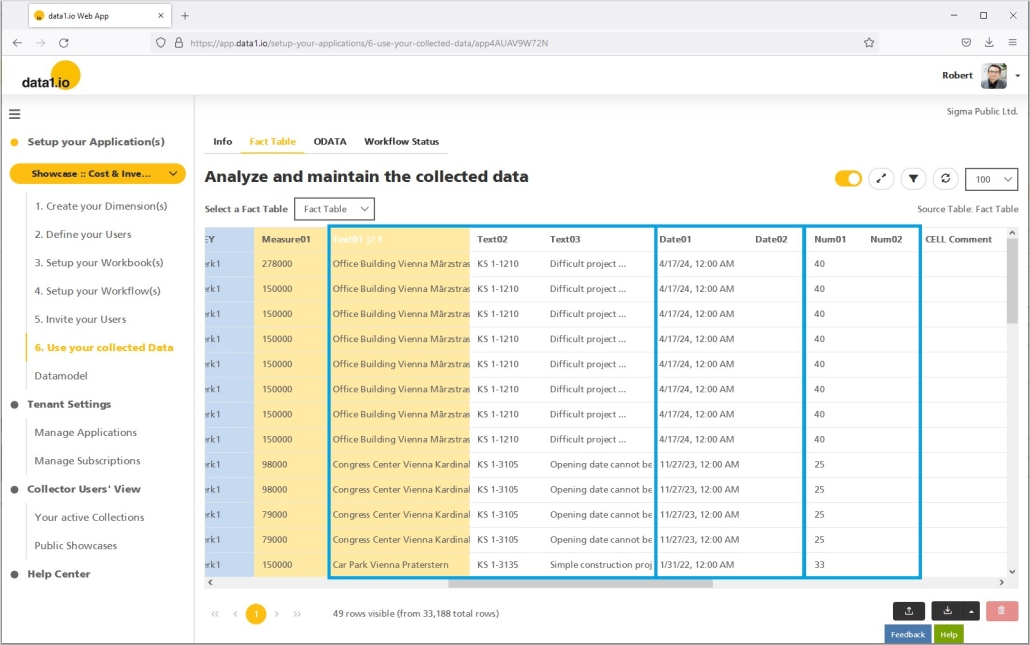
Look at the Cost & Invest Public Showcase. Until now the date and the numeric information …

… had to be stored on one of the 10 text attribute fields:

Now it is possible to allocate this kind of information to the DATE or NUM attributes of the fact table:

This means that the data from the spreadsheet is stored in a proper format in the fact table:

This is important because it is now possible to do proper calculations with those information in the spreadsheet.

(4) Web Client: Changes in Multi-Sheet Workbooks

We have observed that the multi-sheet behaviour was not fully clean.

Until now, when you selected an element in the dimension tree, then ALL sheets where switched to this element and only those were READ which were defined in the SyncSheets_Read Parameter. Now we have changed that so that only those sheets are switched to the selected element which are defined in the SyncSheets_Read Parameter of the activated sheet. This means that in all sheets which are not part of the SyncSheets_Read definition NOTHING happens when selecting a new element in the dimension tree.

If you use this feature please check the behaviour of your workbooks when selecting elements and when changing the data entry sheet.

(5) Showcase: Update for HR Contracts

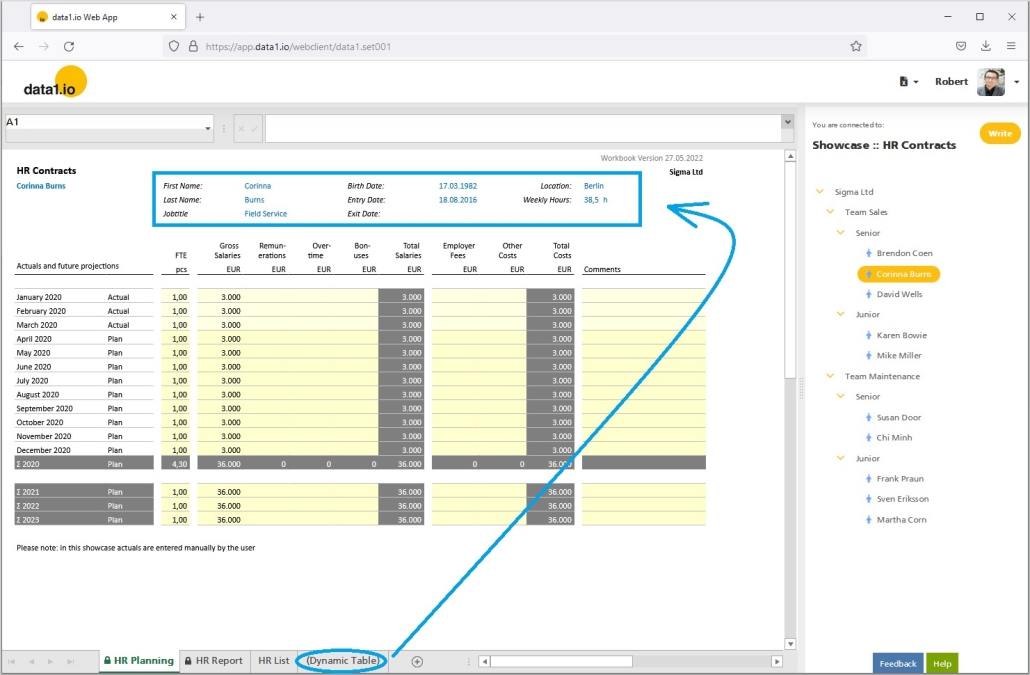
We have extended the showcase for HR Contracts …

… with a new display area for master data for the selected employee:

This feature is realized with a Dynamic Table in the background – for demonstration reasons we let the sheet with the Dynamic Table visible.

(6) Showcase: Update for Cost & Invest

We have extended the showcase for Cost and Invest …

… mainly by translating the whole showcase from German into English language:

Furthermore we have added dropdowns for the Invest- and Real Estate Planning sheets and the date and numeric master data is now allocated to the new date and numeric attributes in the fact table (this way calculations with this information will be possible in a future update).

(7) Help Center: New Content

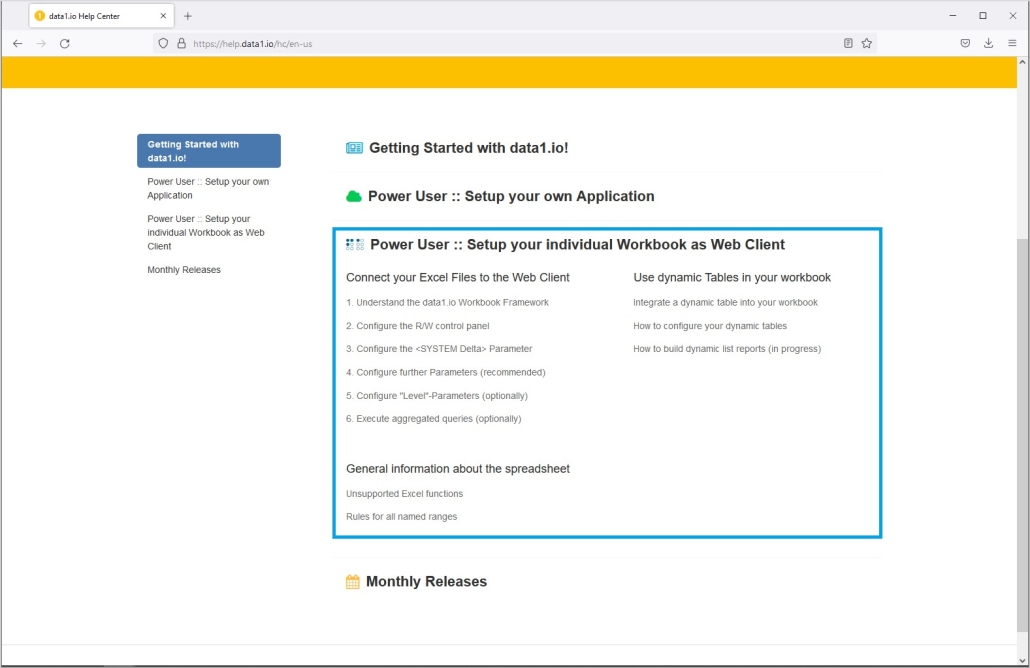
We really happy that we have (mostly) solved an issue of the past: we have massively extended your Help Center with a lot of new content. You can find now nearly everything about defining your own application …

… and setting up your individual workbooks as data1.io Web Client:

(8) Technical Improvements and Debugging

We had some issues with the entry of dates on the new date attributes in the fact table. The language settings were sometimes confused and dates had to entered in US format although shown in a GERMAN format in the spreadsheet itself (and vice versa).

Furthermore we solved an issue when the query for a dynamic table failed under specific circumstances.

Last but not least there was an issue with the landing page in the Web App for users after they create their first own application.


Hope you like the new features – we are very curious about your feedback! Please let us know what you think and what kind of collection processes you would prefer to automate with data1.io. 

Stay healthy and we #StandWithUkraine
Release April 2022

We are happy to deliver the brandnew April 2022 release with the new User Interface for Excel workbooks. Try it now!

Remember, the Web Client is the user friendly spreadsheet for your Collector Users to deliver their monthly/weekly/daily data. The Web App is the tool for the Power User to setup and control your organization’s collection workflows.

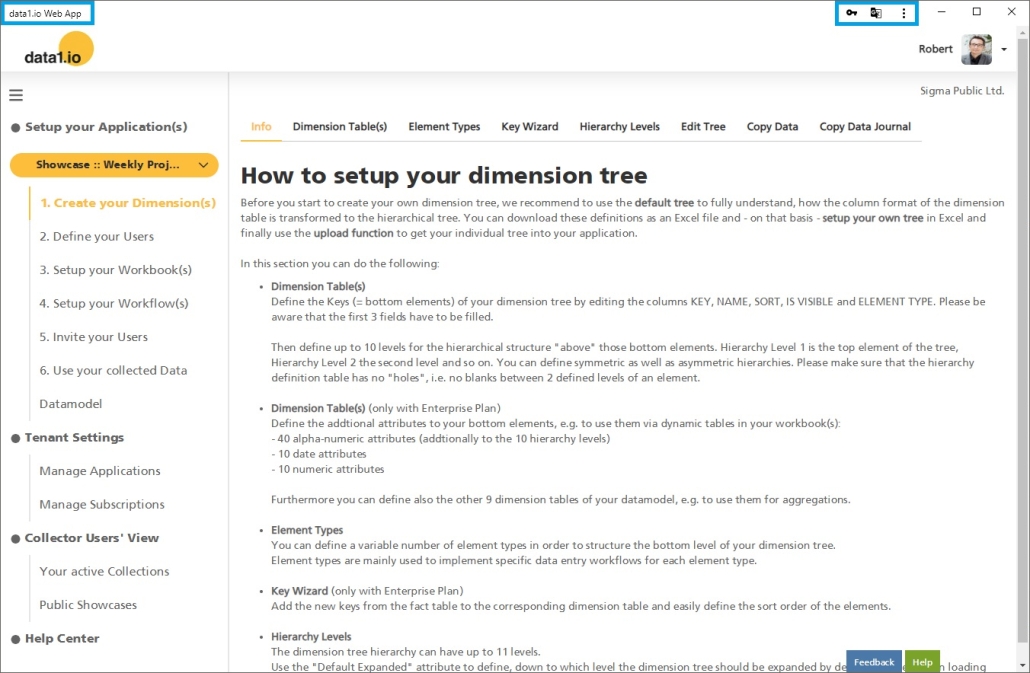
(1) Web App: New “Manage Workbooks” UI

We are happy to relaunch the Workbooks section in the Web App! You will find a new compact User Interface (UI) which is mainly represented by the new workbook list in the “Manage Workbooks” tab which directly lets you start either the Preview of the workbook …

… or lets you edit, add or delete the workbooks master data and lets you upload your local Excel Files as workbook for the Web Client:

For comparison check here the old user interface:

(2) Web App: New Workbook Preview UI

The preview for the workbook is now integrated into the “Manage Workbooks” tab. By clicking the new Preview button you get directly into the preview mode – this is much faster than in our user interface to date:

For comparison check here the old user interface:

(3) Web App: New Workbook Wizard UI

The Workbook Wizard is now also integrated into the “Manage Workbooks” tab. In the new UI it is only possible to enter the Wizard for workbooks which do not have an uploaded Excel file – this is more intuitive and logical:

For comparison check here the old user interface:

(4) Showcase “Weekly Project Status”: new dynamic list report

In the June 2021 Release we presented the new dynamic list reports based on the new list form for the “data1_CELLS01_DIM001” parameter. At that time this was demonstrated in a private showcase, now we added the feature to the Public Showcase “Weekly Project Status”:

(5) Dynamic List Reports: activation for any record granularity

This upgrade for the public showcase was possible now since the inital feature for the list form of the “data1_CELLS01_DIM001” parameter did not work with every form of record granularity. This public showcase uses a special record structure since it has to be compatible with a Power Apps application which is also used to add and edit the same data. With this release the list form of the “data1_CELLS01_DIM001” parameter is compatible with every recordset structure:

(6) Technical improvements and debugging

We have debugged an issue with the edit function for the dimension tree, the menu was shown on the wrong level in special cases. Furthermore we have improved the behaviour for highlighting changed cells, the initial functionality was not fully matured.

(7) Discontinued Feature: Excel Client (Javascript Add-In)

Until the beginning of 2020 the Excel Client – based on an innovative Javascript Add-In – was the only user interface for the collector users. Due to continuing heavy technical restrictions with the Excel Client (esp. in conjunction with Excel Online) we decided then to develop a new fully browser based client. In the meantime this “Web Client” has fully replaced the older “Excel Client”. So we have decided to officially discontinue this feature since it would bind to many ressource to keep it on the same level as the Web Client.

Therefore we removed the navigation item “Excel Client” from the user interface of the Web App:


Hope you like the new features – we are very curious about your feedback! Please let us know what you think and what kind of collection processes you would prefer to automate with data1.io. 

Stay healthy and we #StandWithUkraine

Release March 2022

We are happy to deliver the brandnew March 2022 release with new showcases and new features for filter tables. Try it now!

Remember, the Web Client is the user friendly spreadsheet for your Collector Users to deliver their monthly/weekly/daily data. The Web App is the tool for the Power User to setup and control your organization’s collection workflows.

(1) New showcase “S&OP Demand Planning”

We are happy that we can present now our showcase #8, the new “S&OP Demand Planning”:

This showcase uses a dynamic definition table with the individual combination “customers – products”:

Selecting another customer of course changes the list of products for this customer:

Please be aware that at this stage this showcase has only a few demo data, we will upgrade this showcase with the next month releases.

(2) Improved showcase “HR Contract”

The “HR Contracts” showcase one our first showcases …

… so we decided to add a new dynamic list report with all the employees and their annual planning values:

Remember, the dynamic list reports feature was introduced with the July 2021 release. Of course the list report is dynamically requeried when selecting another item from the dimension tree:

(3) Filter Tables: new filter path parameter

For this new showcase we developed a new filter path parameter which is essential in application with “same name elements” in the dimension tree. If you retrieved a dynamic filter table until now …

… with focus on an ambiguous element in the dimension tree the table delivered all the bottom level elements from all subnodes with the same name:

To solve this we introduce a new parameter:

  • data1_CELLS01_DIM001_Key_Path

This field is filled with every click in the dimension with the full “SQL Where” path which can be used directly as filter criteria for the dynamic filter table:

(4) Filter Tables: new RLS option

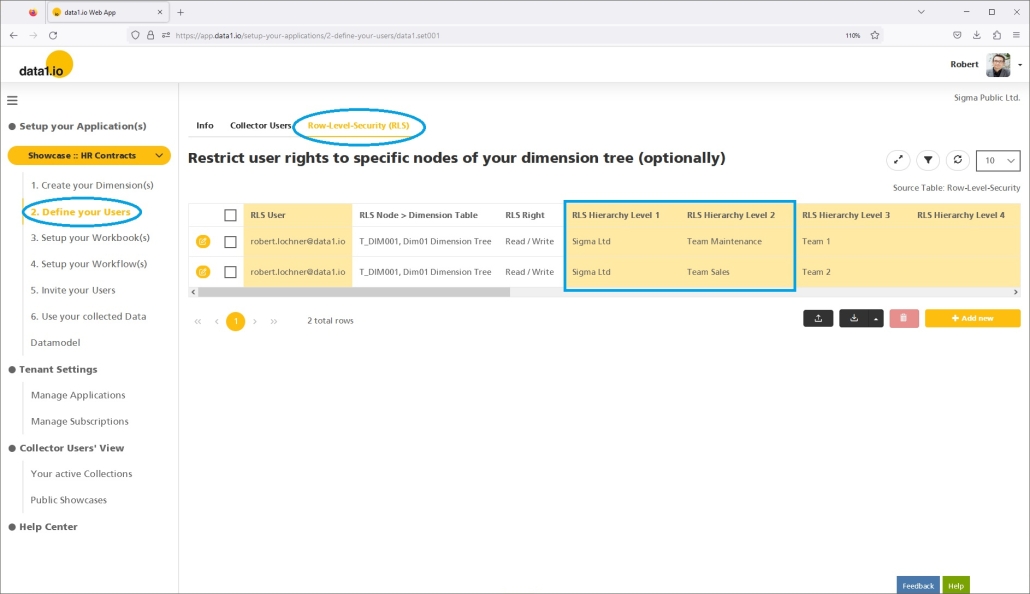
Another important issue is the application of Row-Level-Security to dynamic filter tables. Until now, this was not possible and therefore filter tables delivered always the full list of elements independently of the RLS rules:

With this release we introduce the new parameter

  • data1_CELLS01_InsertTable_ForceRLS

which can be set to “0” (= default, no RLS) or to “1” (= RLS is applied to the filter table):

We intend to make the “Force RLS” feature to the new default with a later release.

(5) Web App: new “Is Visible” field

In some cases you need to keep an element in the dimension tree (e.g. for historical data) but you do not want to show the element in the dimension tree anymore. For this reason we added the new “Is Visible” definition field to all dimension tables. Setting an element to “false” …

… will remove this item from the dimension tree:

(6) Web App: new subscription form

With the September 2021 release we introduced the new UI forms for workflows and for the company data. With this release we deliver now also the Subscriptions with the new UI element. Since a company can have several subscriptions you`ll see at first the overview list with all active subscriptions …

… and clicking on one element of the list will open the form:

Please be aware that at this time the subscriptions cannot be edited by yourself (i.e. all the fields are read-only).


Hope you like the new features – we are very curious about your feedback! Please let us know what you think and what kind of collection processes you would prefer to automate with data1.io. 

Stay healthy and we #StandWithUkraine

Release February 2022

We are happy to deliver the brandnew Februar 2022 release with the new Performance Analyzer and many more. Try it now!

Remember, the Web Client is the user friendly spreadsheet for your Collector Users to deliver their monthly/weekly/daily data. The Web App is the tool for the Power User to setup and control your organization’s collection workflows.

(1) Web Client: New Performance Analyzer

We learned that a weak performance in the Web Client can have different causes. One reason is a poor SQL performance, another one is a poor performance of the client device itself. For this reason we have developed the new Performance Analyzer to give our users a tool to analyze by themselves directly on the point of interest.

Just execute a READ or a WRITE process …

… and press

  • CTRL + ALT + P

and you will geht a popup with the Performance Analyzer:

Just expand the symbol on the left to get a pie chart with the SQL share on total performance:

Expand further to get the details about the single steps of the process:

(2) Web Client: New highlighting for updated cells

We are happy about this new feature to highlight cells that were updated and not saved yet:

To activate it define a named range for a single cell:

  • data1_CELLS01_ChangedCellFormat

Now format the cell to your taste – that`s all!

Please keep in mind that all data1.io named ranges in the workbook have to be defined on sheet level and not on workbook level.

(3) Web Client: New easy setup for new record definition mode

We introduced the new “record definition mode (by column)” in November 2021 and updated it in January 2022.

Now we are happy to be able to deliver an “easy setup” since the definition was a little bit complicated …

… from now on you can use the following wildcards instead of the recordset numbers:

  • Definition *
    The content of the column will be added to all records of the respective row in the spreadsheet (horicontal definition).
    The content of the row will be added to all records of the respective column in the spreadsheet (vertical definition).
  • Definition + or –
    The content of the column / row will generate a recordset on its own

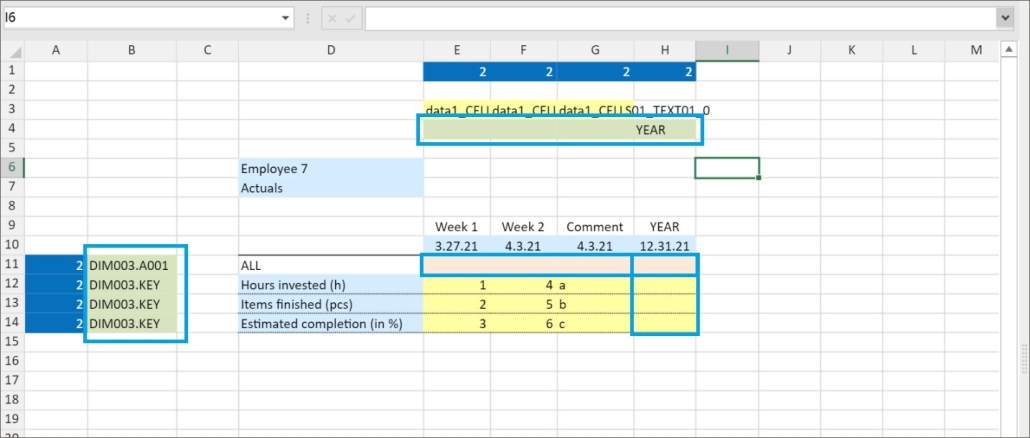
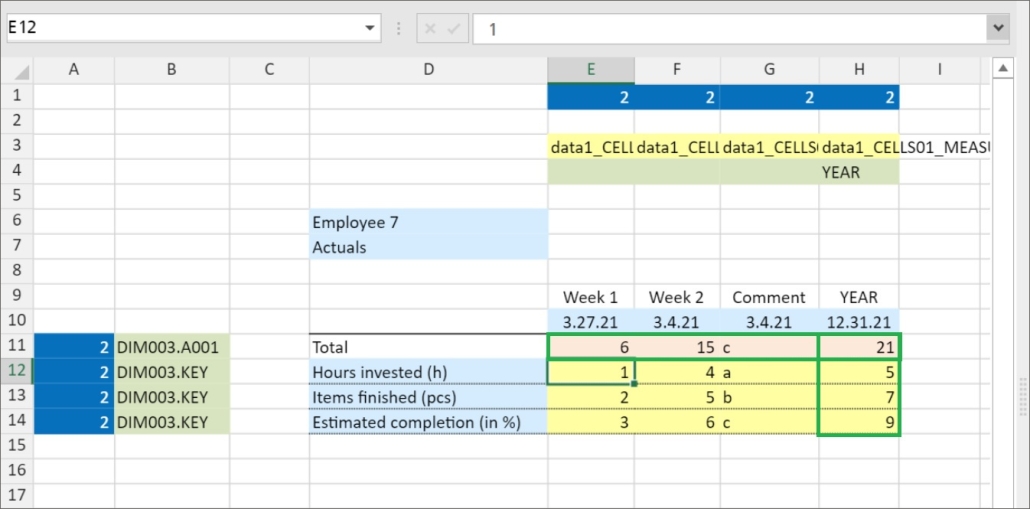
Just remember: the new record definiton mode enables to append base data (blue frame) to the records with the figures …

… as can be seen here in the fact table:

(4) Web App: New merge fields for multi-workbook applications

We have introduced the Multi-Workbook feature back in April 2021 and the Multi-Workflow feature back in June 2021. We introduced the merge field {WEBAPP.WORKFLOW.URL} in November 2021 to make a multi-workflow accessable via a link.
Now it is time to deliver 4 new merge fields to adress a specific workbook in a multi-workbook environment:

  • {WEBAPP.WORKBOOK.SORT.01.URL}
  • {WEBAPP.WORKBOOK.SORT.01.NAME}
  • {WEBAPP.WORKBOOK.UID.01.URL}
  • {WEBAPP.WORKBOOK.UID.01.NAME}

They differ the following:

  • URL generates the name of the workbook as a clickable link
  • NAME generates the name of the workbook only as a text

The SORT.01 means that you want to adress the first workbook in the relative order of workbooks within your application. UID.01 means that you want to adress the workbook with this absolute UID.

Look at this demonstration in the above shown multi-workbook environment …

… all 4 merge fields deliver the Workbook name “Workbook Actuals”, 2 of them as a clickable link:

(5) Web App: New Streaming for XLSX-/CSV-downloads

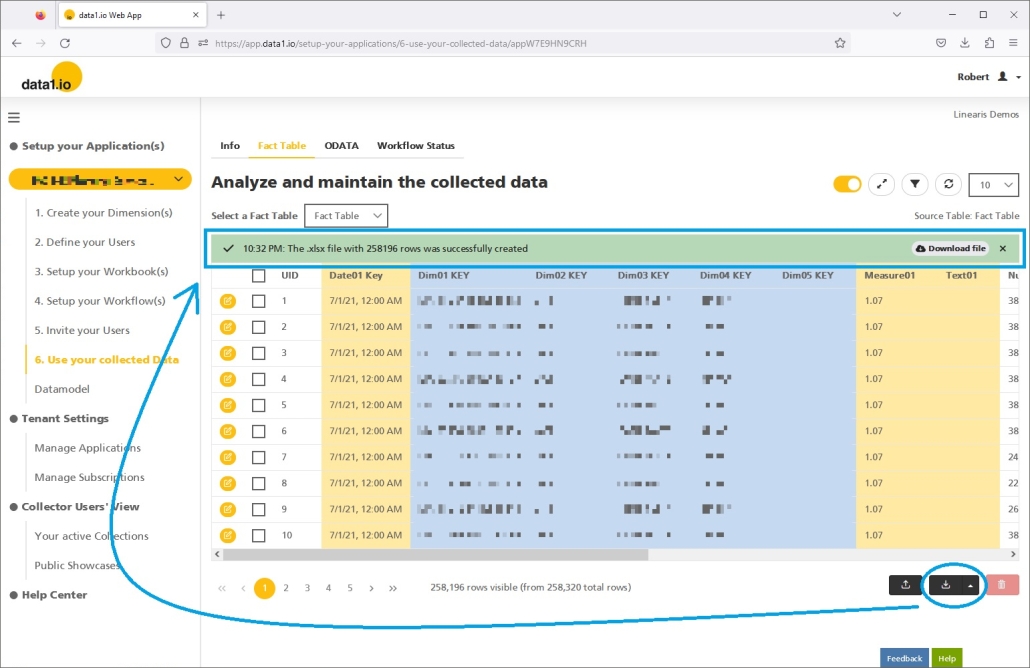
There was an issue when downloading a larger amount of data from a (fact) table in the Web App, since the download could stopped with an error message.

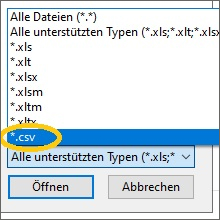
With the new streaming implementation, the download of the records into an .xlsx or .csv es executed piece by piece. This also saves memory usage (e.g. 0,5 GB instead of 1,5 GB for downloading 65.000 records).

(6) Public Showcases: Dynamic table demo

We have introduced the dynamic table feature in the July 2021 Release, now we have added the demo to the “Weekly Project Status” Public Showcase:

You` ll find the demo in the second sheet called Dynamic Table. Please note that the two sheets are not synced, therefore the read processes are triggered independantely from each other.


Hope you like the new features – we are very curious about your feedback! Please let us know what you think and what kind of collection processes you would prefer to automate with data1.io. 

And: stay healthy!